🏙️ Explainable GeoAI for Urban Wildfire Structure Loss

Parastoo Farajpoor and Mohammadreza Narimani* (corresponding author)

Frontiers in Sustainability · Volume 7 · Article 1975724 · 7 October 2026 · Open access CC BY

Department of Biological and Agricultural Engineering · University of California, Davis

Urban Wildfire as a Systems Problem

Wind-driven fires that enter dense neighborhoods are not simply larger wildfires. Once buildings ignite, structures become fuel and fire can travel through the built fabric after the wildland flame front has passed. City-scale tools often look skillful until they are tested in spatially separated settings.

This original research by Parastoo Farajpoor and Mohammadreza Narimani (corresponding author) builds a spatially validated GeoAI workflow for the January 2025 Palisades Fire. It links 12,081 CAL FIRE damage inspections to pre-fire Sentinel-2 vegetation amount and moisture, Landsat surface temperature, LANDFIRE fuels, 10 m terrain, and a dated OpenStreetMap layer of buildings and roads.
Core story: neighborhood building count and vegetation moisture help screen urban structure loss—but random cross-validation overstates skill. Spatial blocking is required before maps are used for planning.
12,081CAL FIRE inspections
5,566 / 9,883Residential structures destroyed
0.92 → 0.75ROC-AUC random vs spatial
3.74×OR per SD building count
100 mNeighborhood disk
CC BYOpen-access license
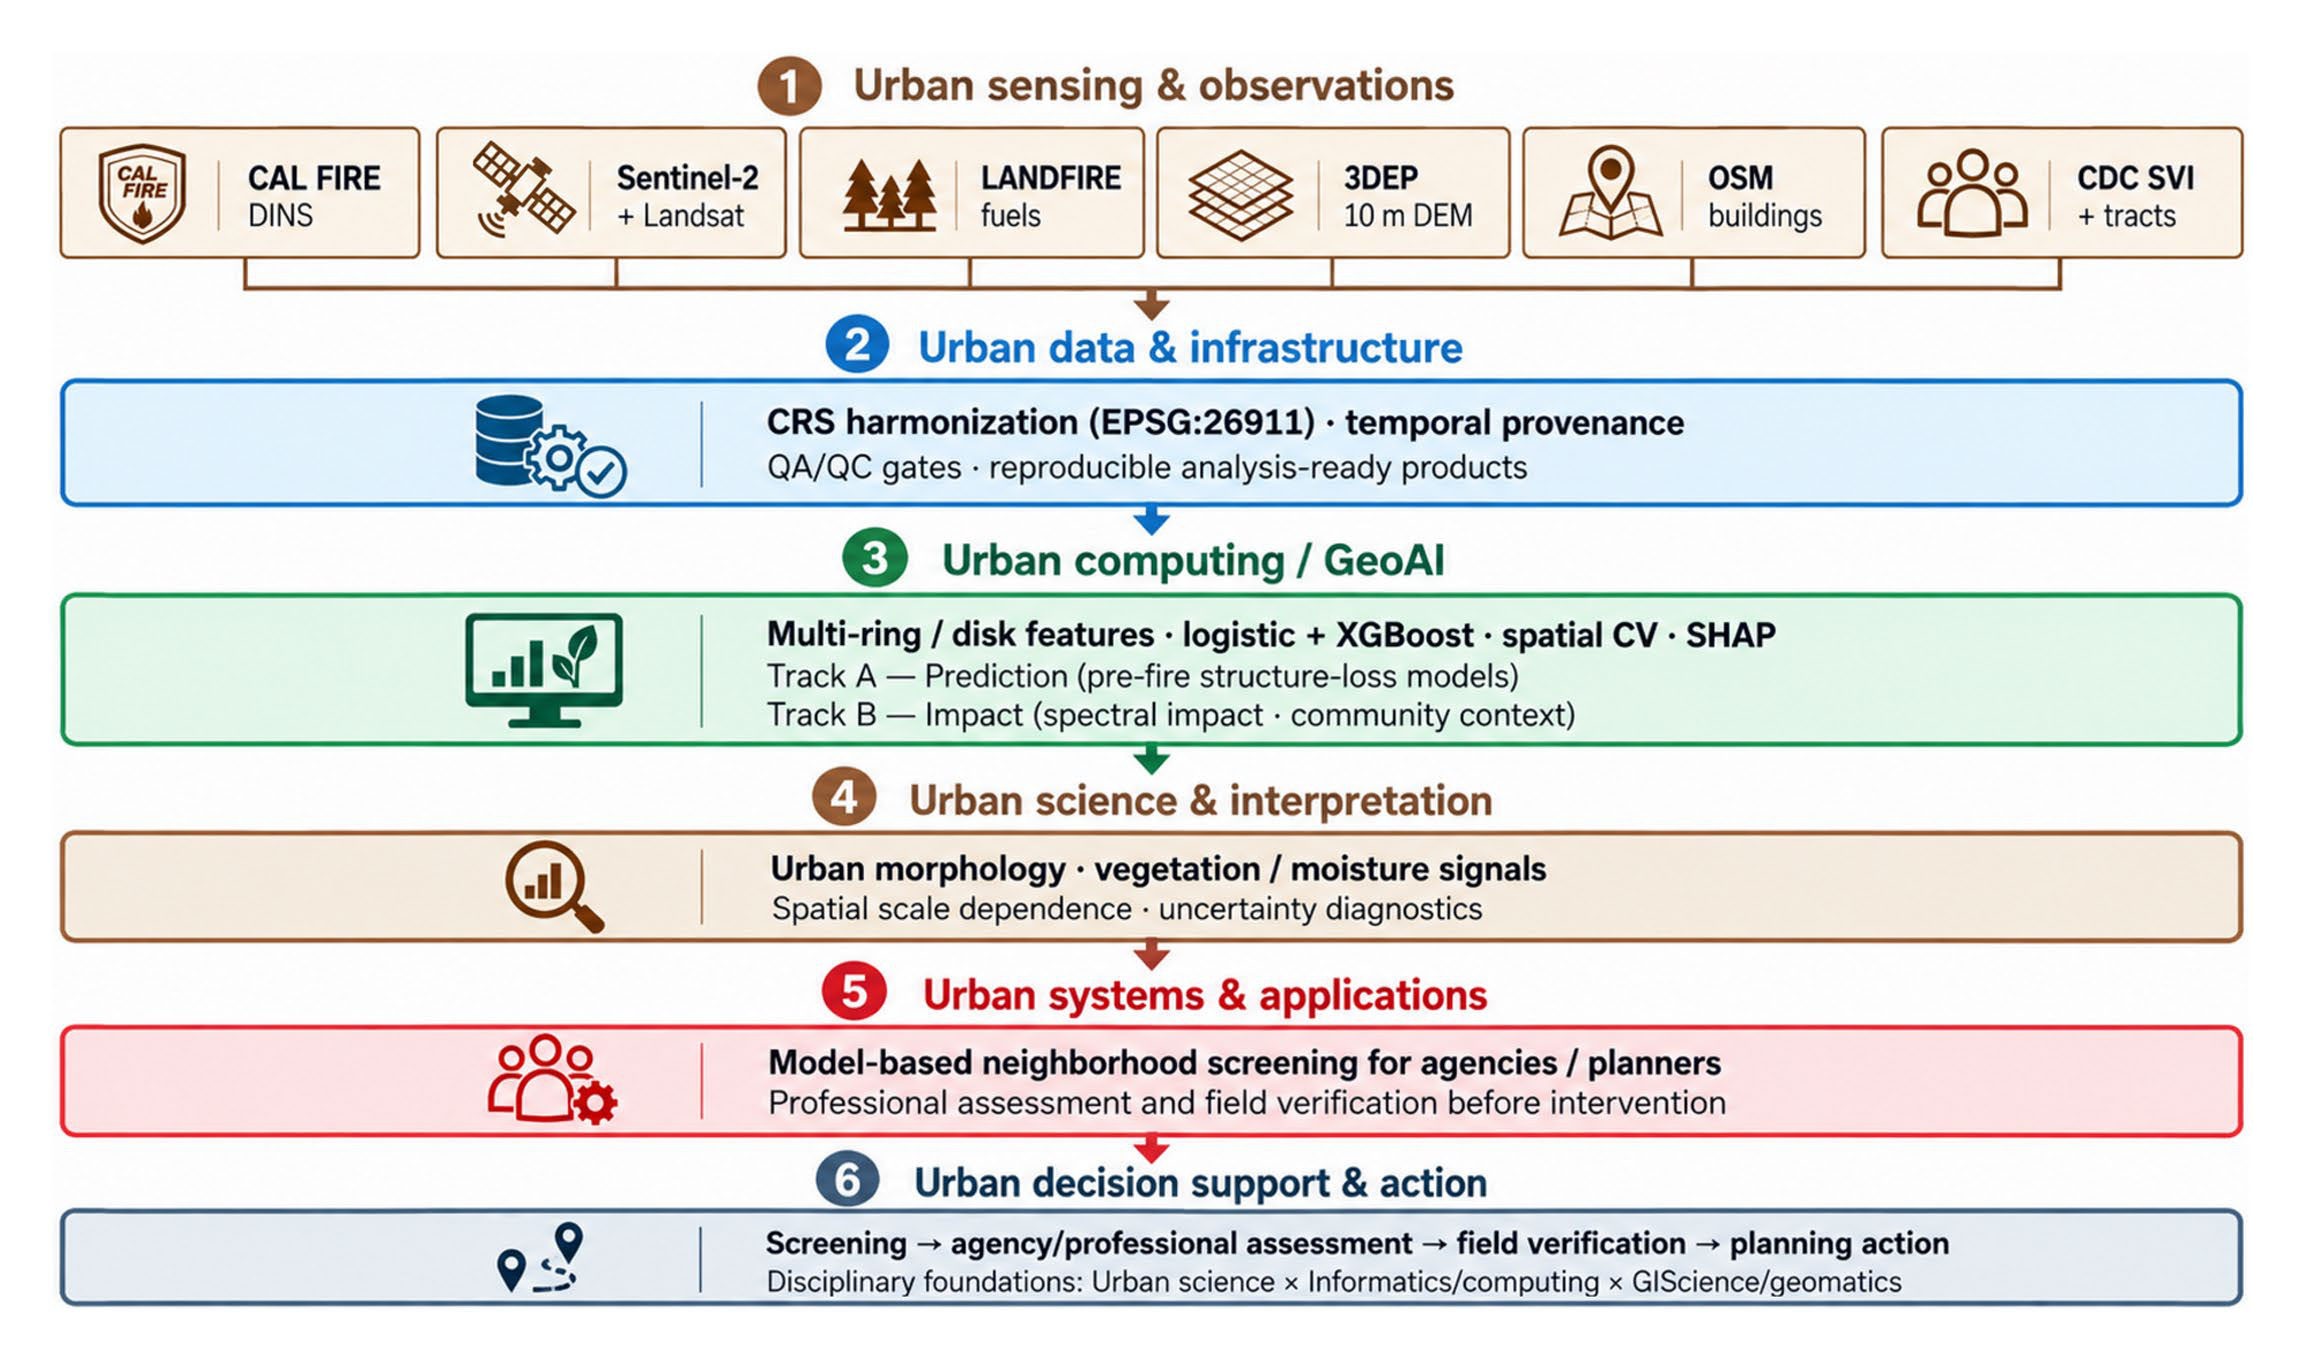
Mohammadreza Narimani explainable GeoAI workflow for the 2025 Palisades Fire from CAL FIRE and satellite observations through spatial cross-validation to neighborhood screening
Figure 1. Urban sensing, GeoAI, and decision-support workflow used in the Palisades study.
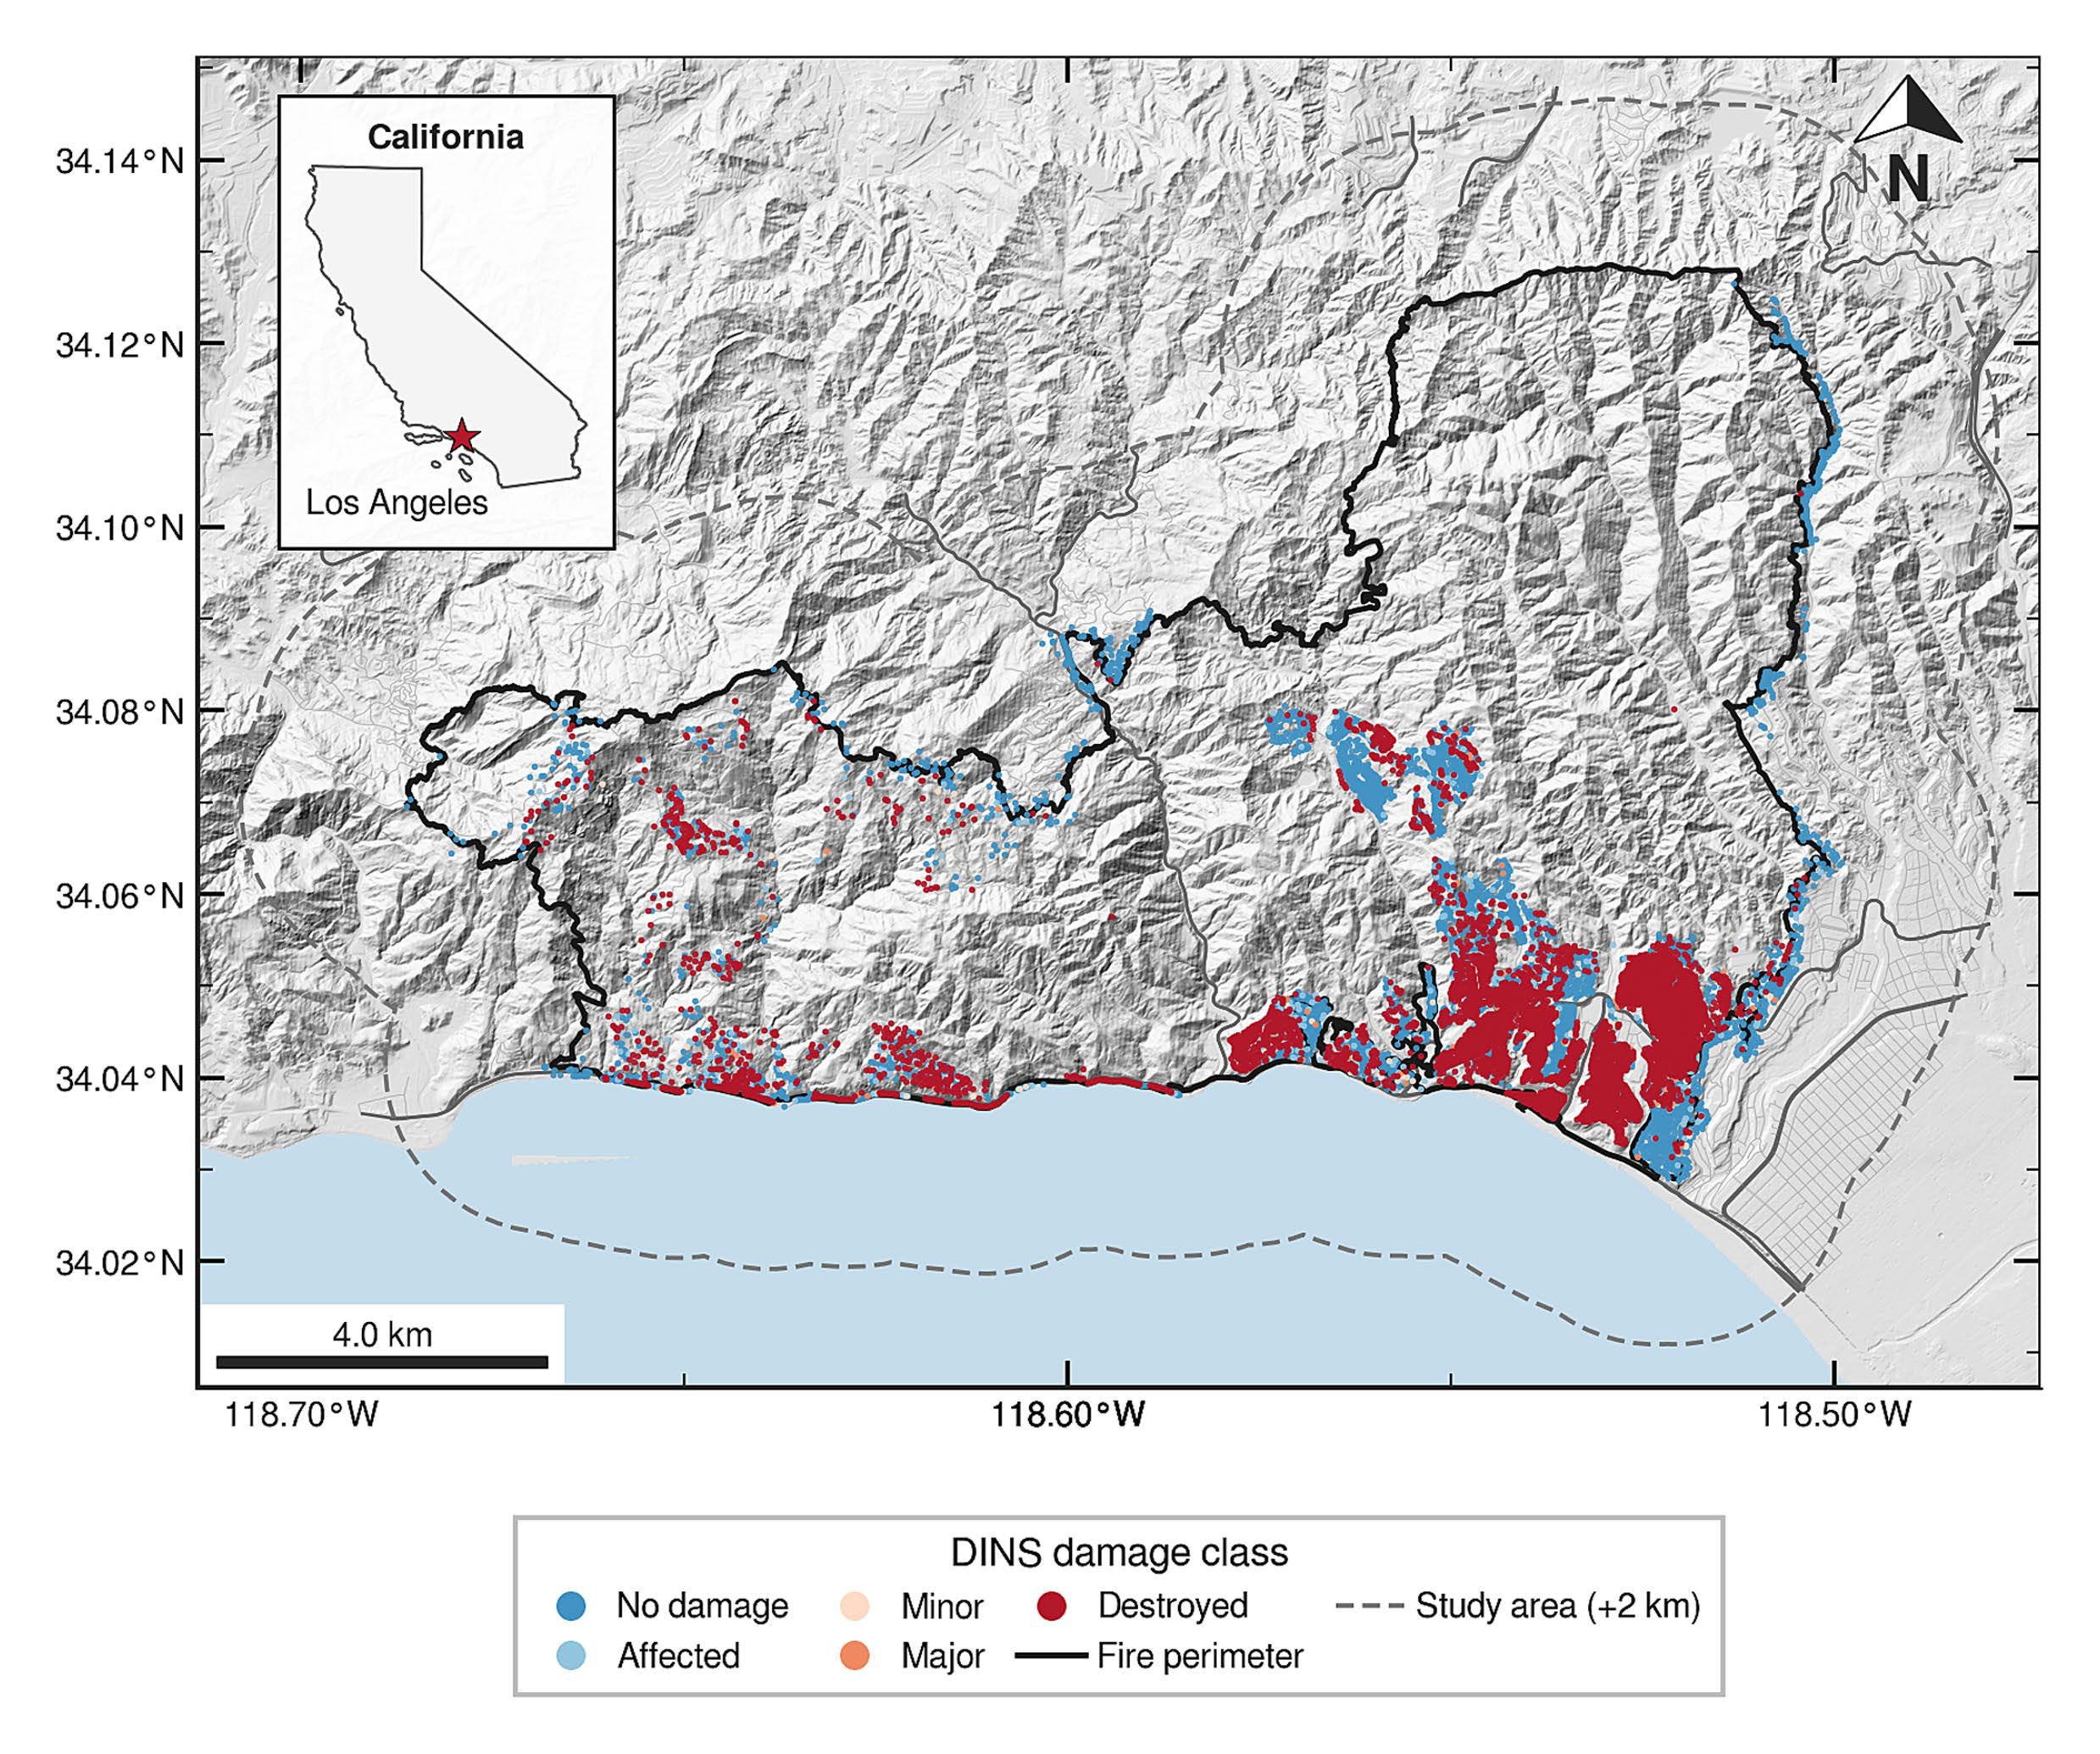
Map of the 2025 Palisades Fire study area by Mohammadreza Narimani showing CAL FIRE DINS damage classes from no damage to destroyed along the Los Angeles coastline
Figure 2. Study area and CAL FIRE DINS damage classes for the 2025 Palisades Fire.
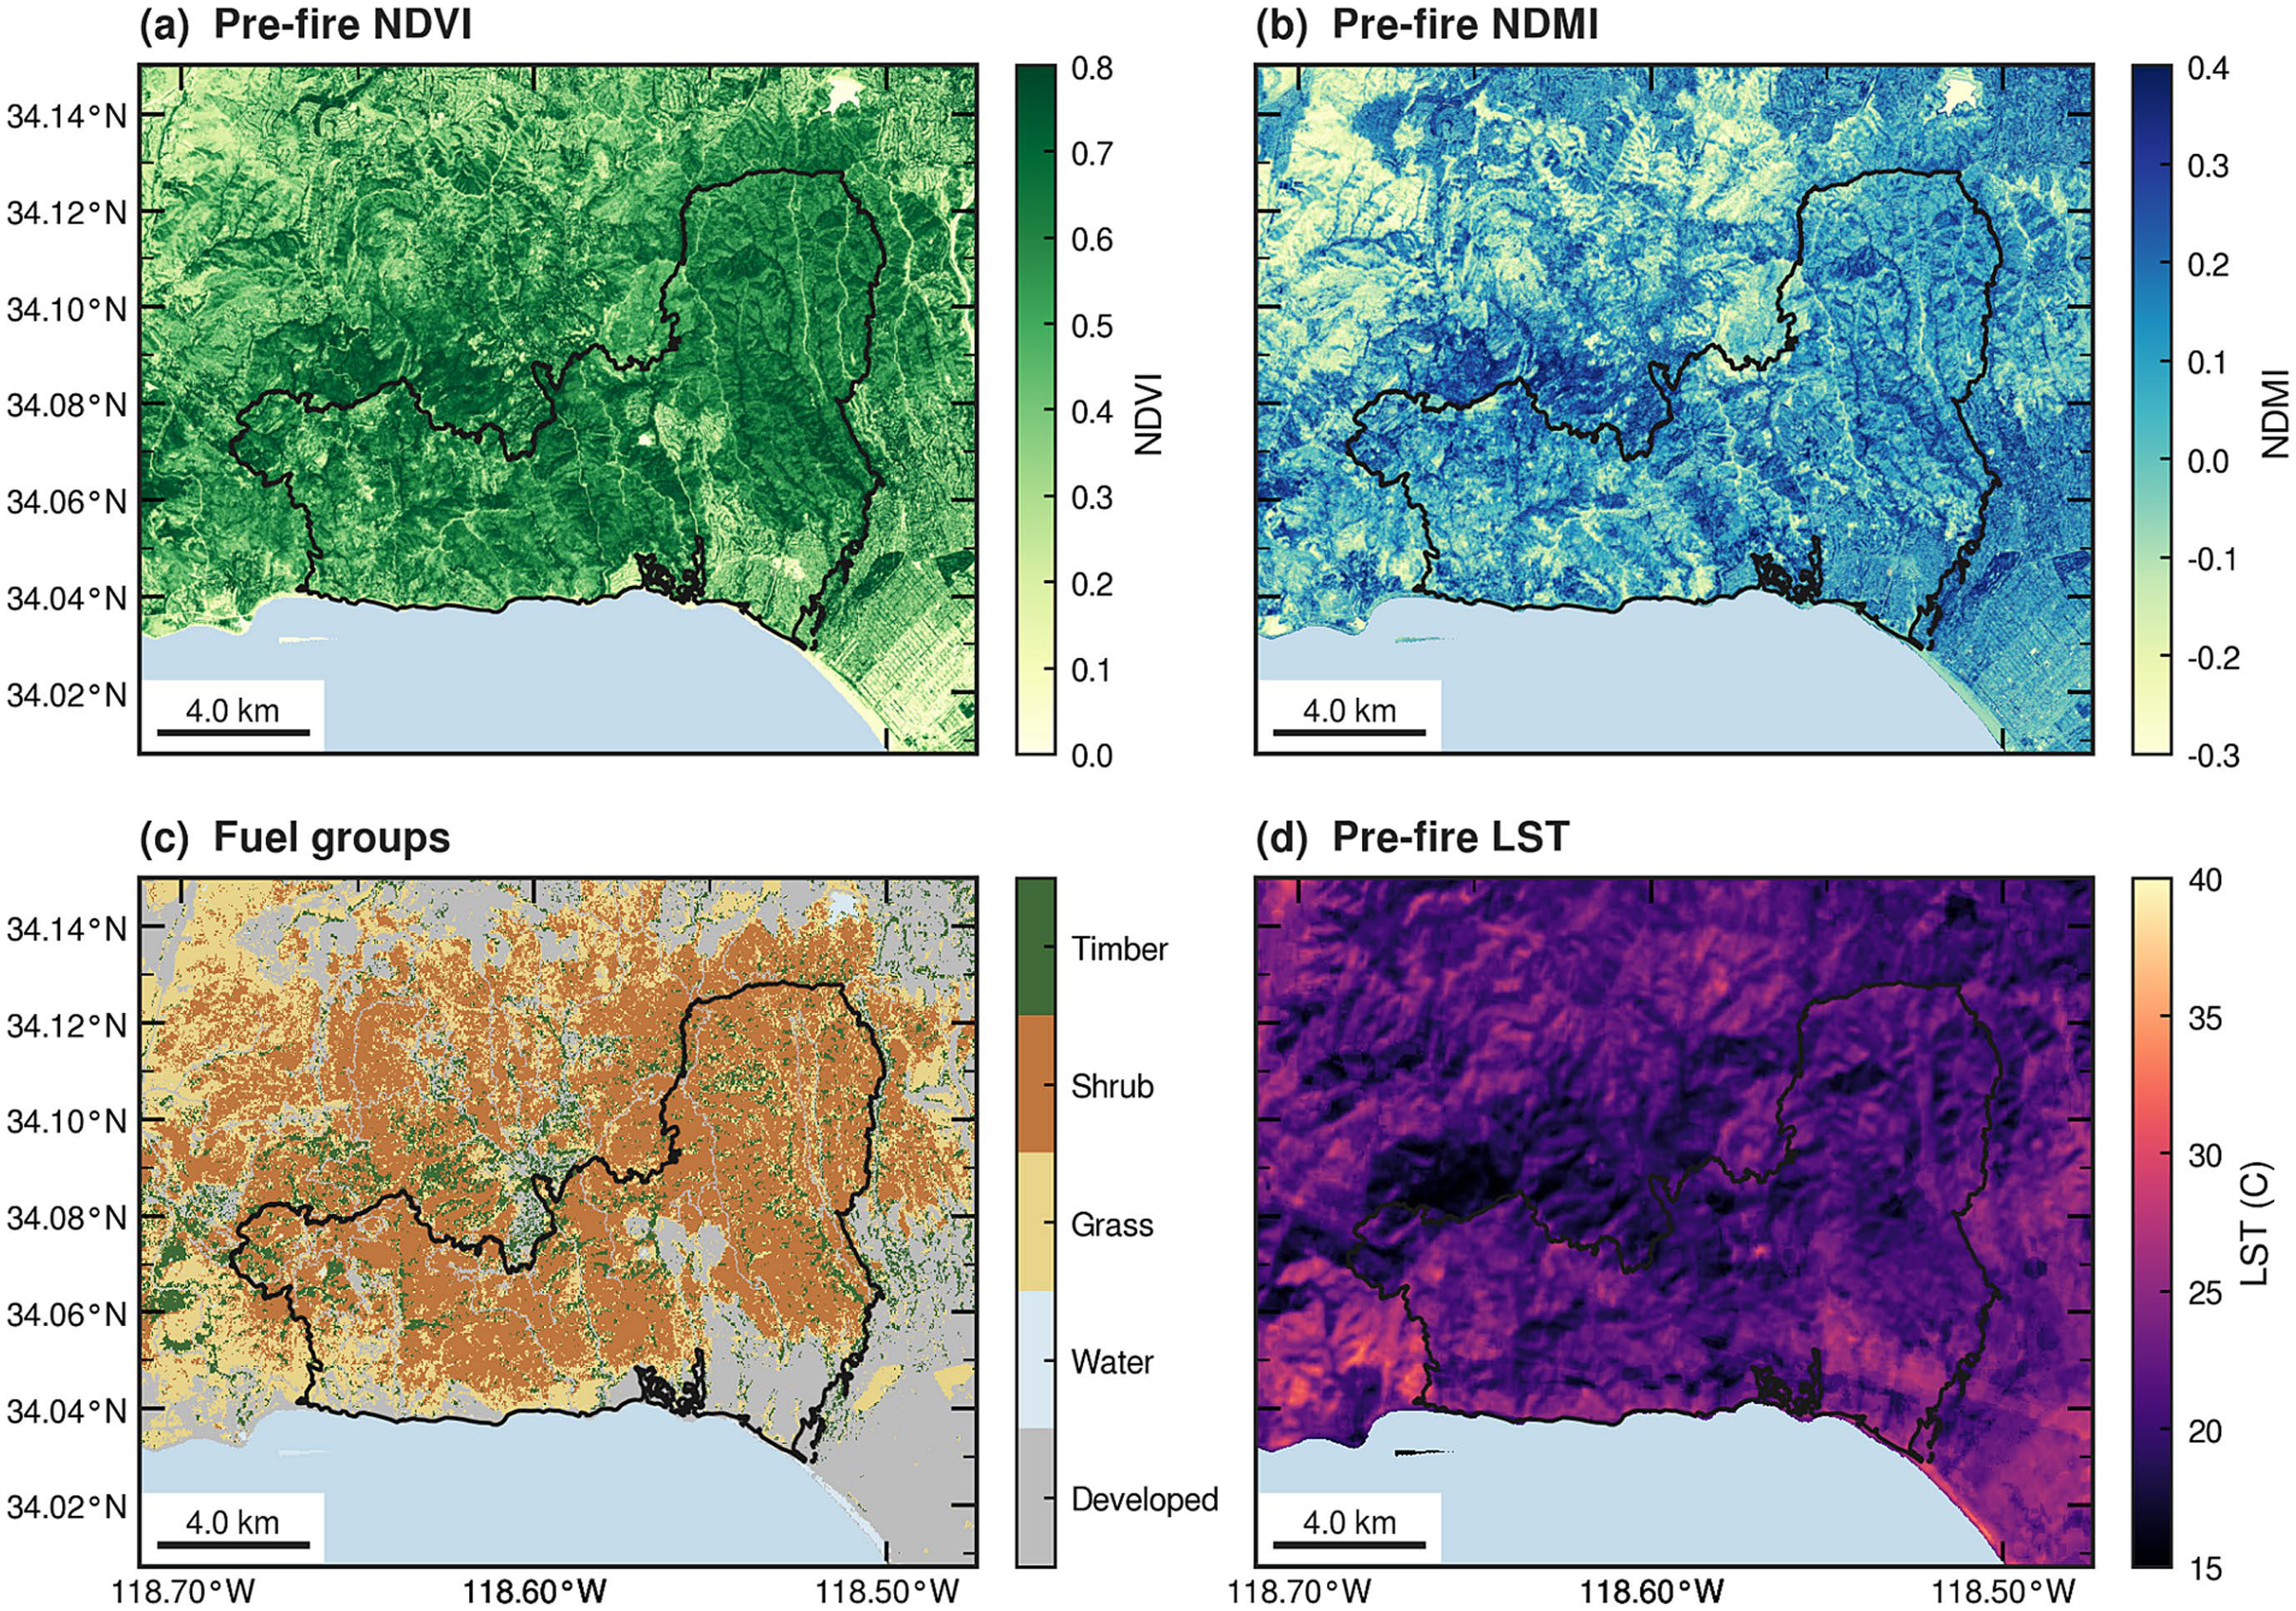
Mohammadreza Narimani pre-fire Palisades maps of NDVI, NDMI, LANDFIRE fuel groups, and Landsat land-surface temperature
Figure 3. Pre-fire environmental conditions: NDVI, NDMI, LANDFIRE fuels, and land-surface temperature.
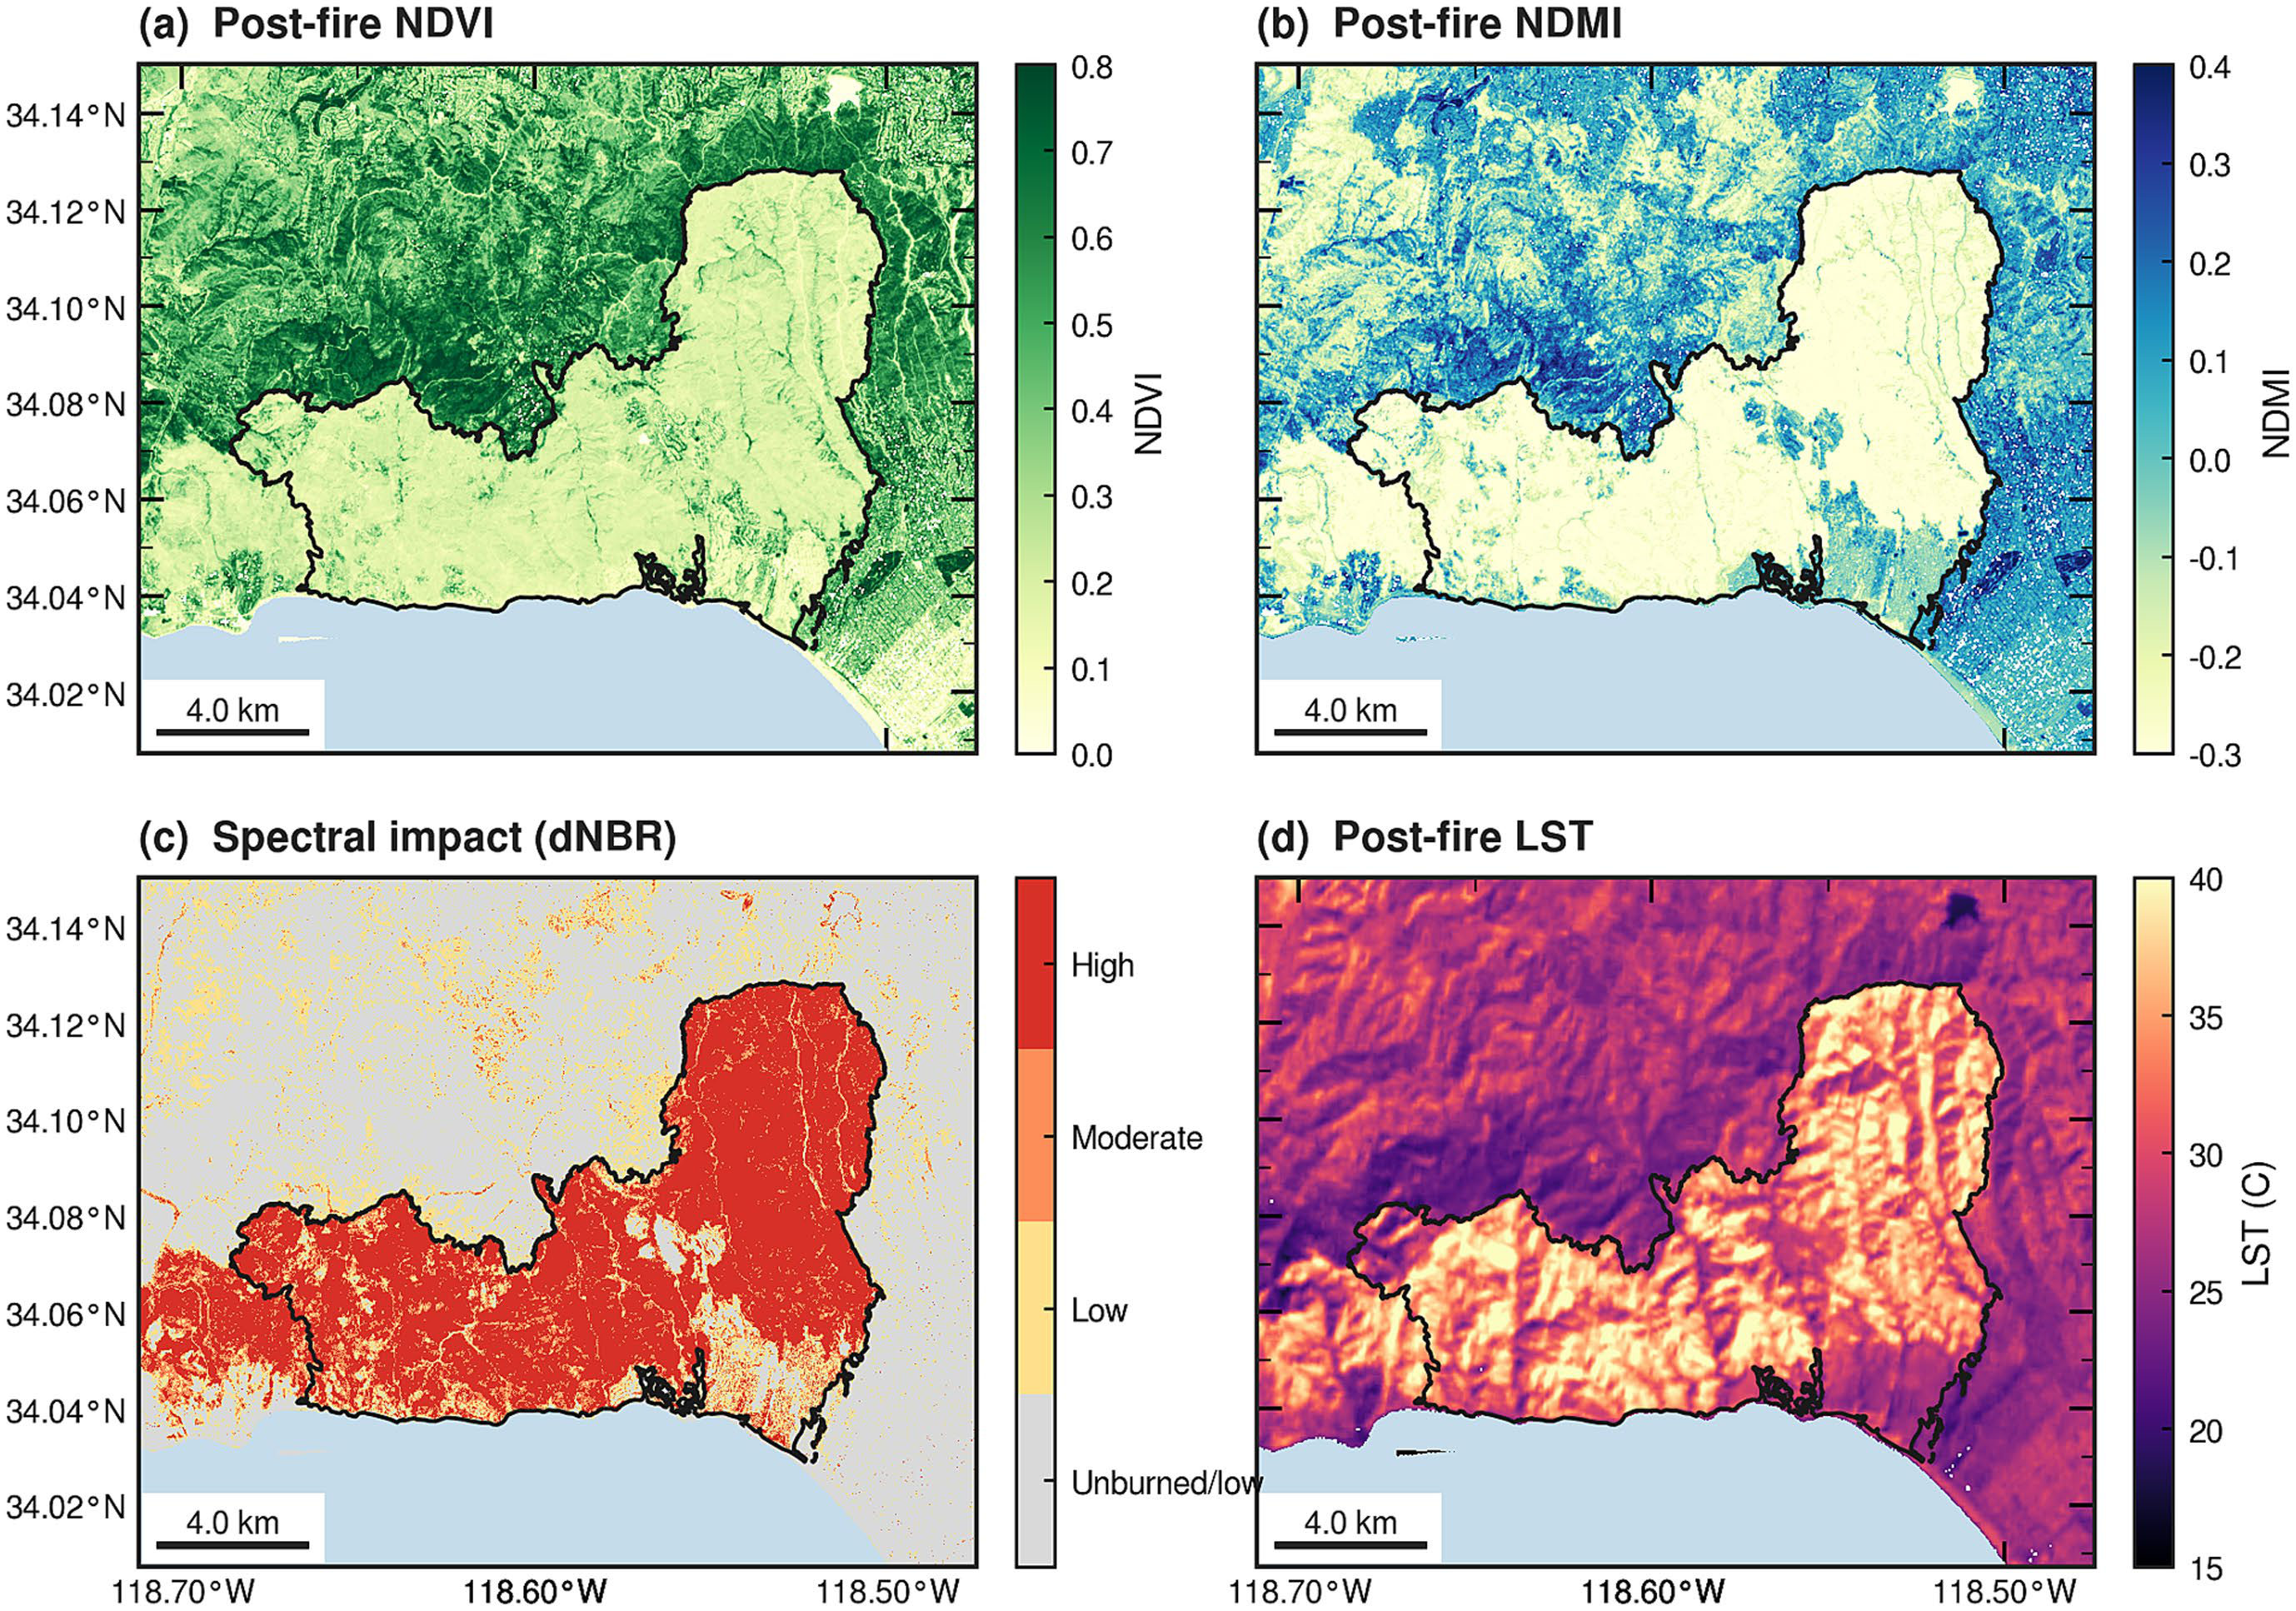
Mohammadreza Narimani post-fire Palisades maps of NDVI, NDMI, dNBR spectral-impact bins, and land-surface temperature
Figure 4. Post-fire spectral context: NDVI, NDMI, dNBR impact bins, and land-surface temperature (not used as predictors).

Built Form and Vegetation Moisture

Residential destruction was modeled with logistic regression and gradient boosting under nested tuning, using both random and 1 km spatial-block cross-validation. Within inspected residential structures, neighborhood building count was the strongest predictor: conditional destruction odds rose 3.74-fold per standard deviation in building count inside a 100 m-radius disk.

Higher neighborhood NDMI (moisture) was associated with lower destruction odds. NDVI’s sign flipped depending on whether it was entered jointly or alone, so greenness-only maps can mislead. Neighborhood-scale features generally outperformed immediate-surrounding sets, with overlapping fold-level variability.
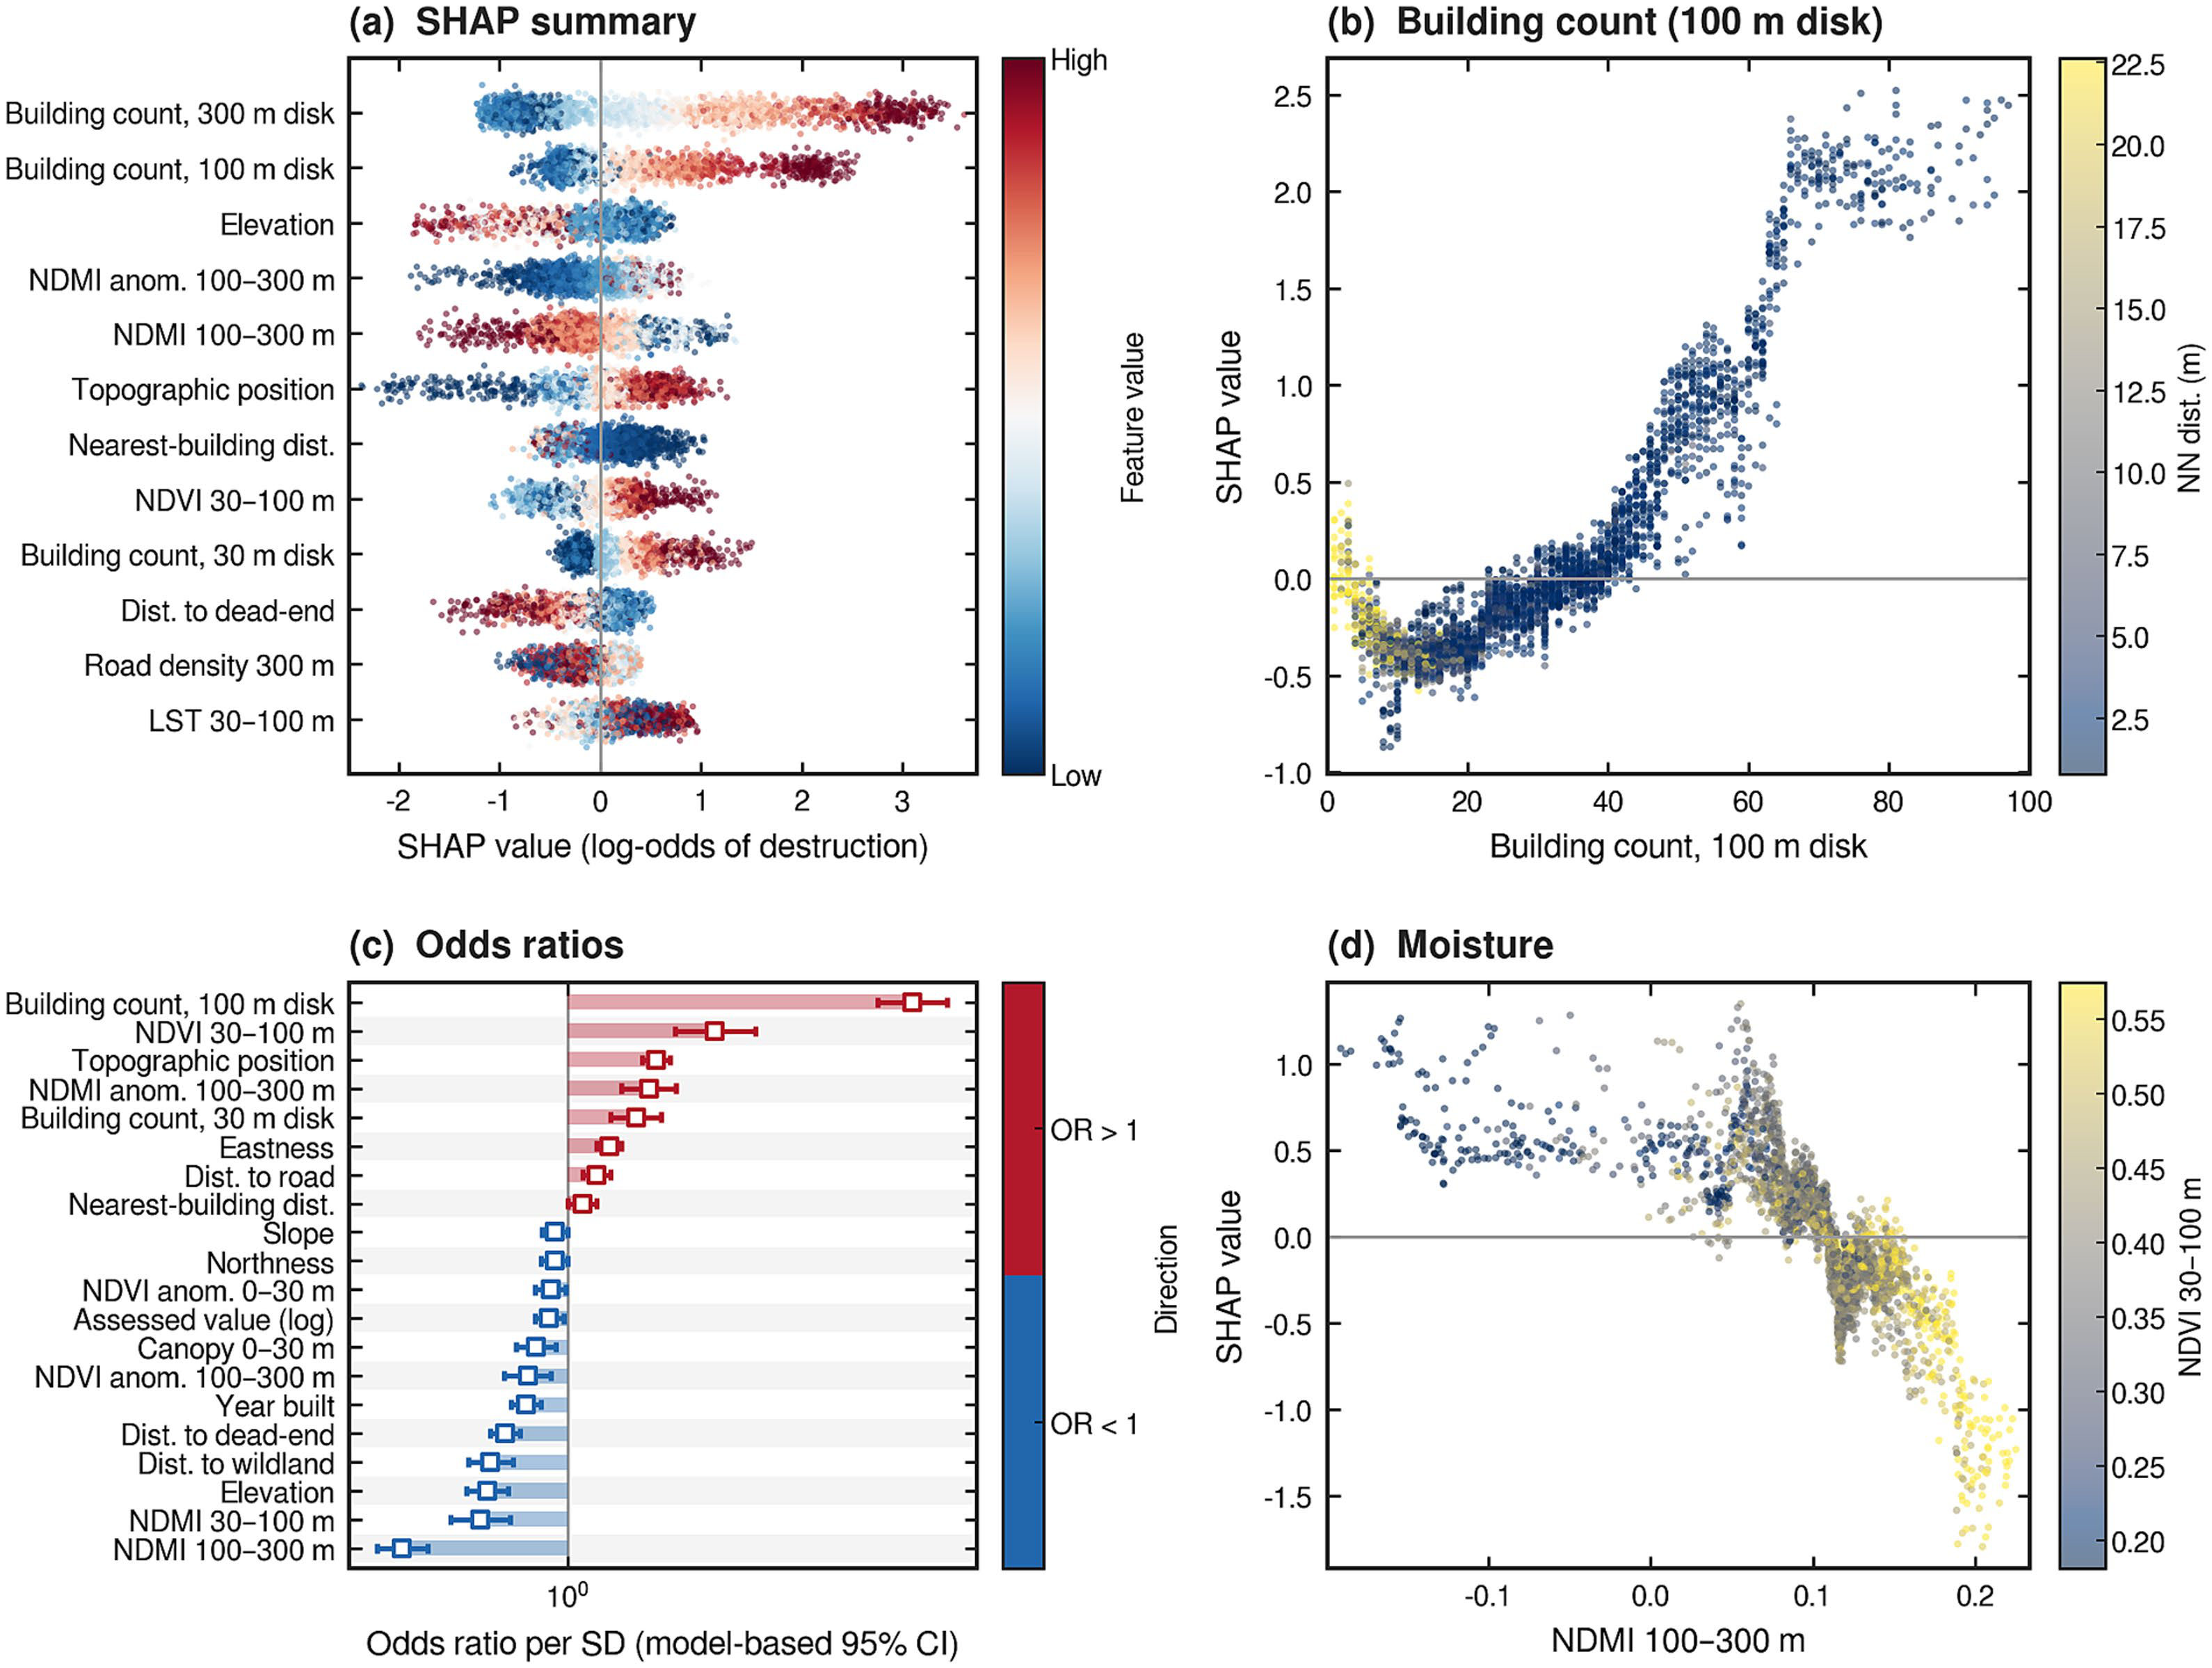
Mohammadreza Narimani Palisades GeoAI SHAP ranking, building-count dependence, logistic odds ratios, and NDMI SHAP dependence for structure destruction
Figure 5. Complementary model summaries: XGBoost SHAP, building-count dependence, logistic odds ratios, and NDMI dependence.
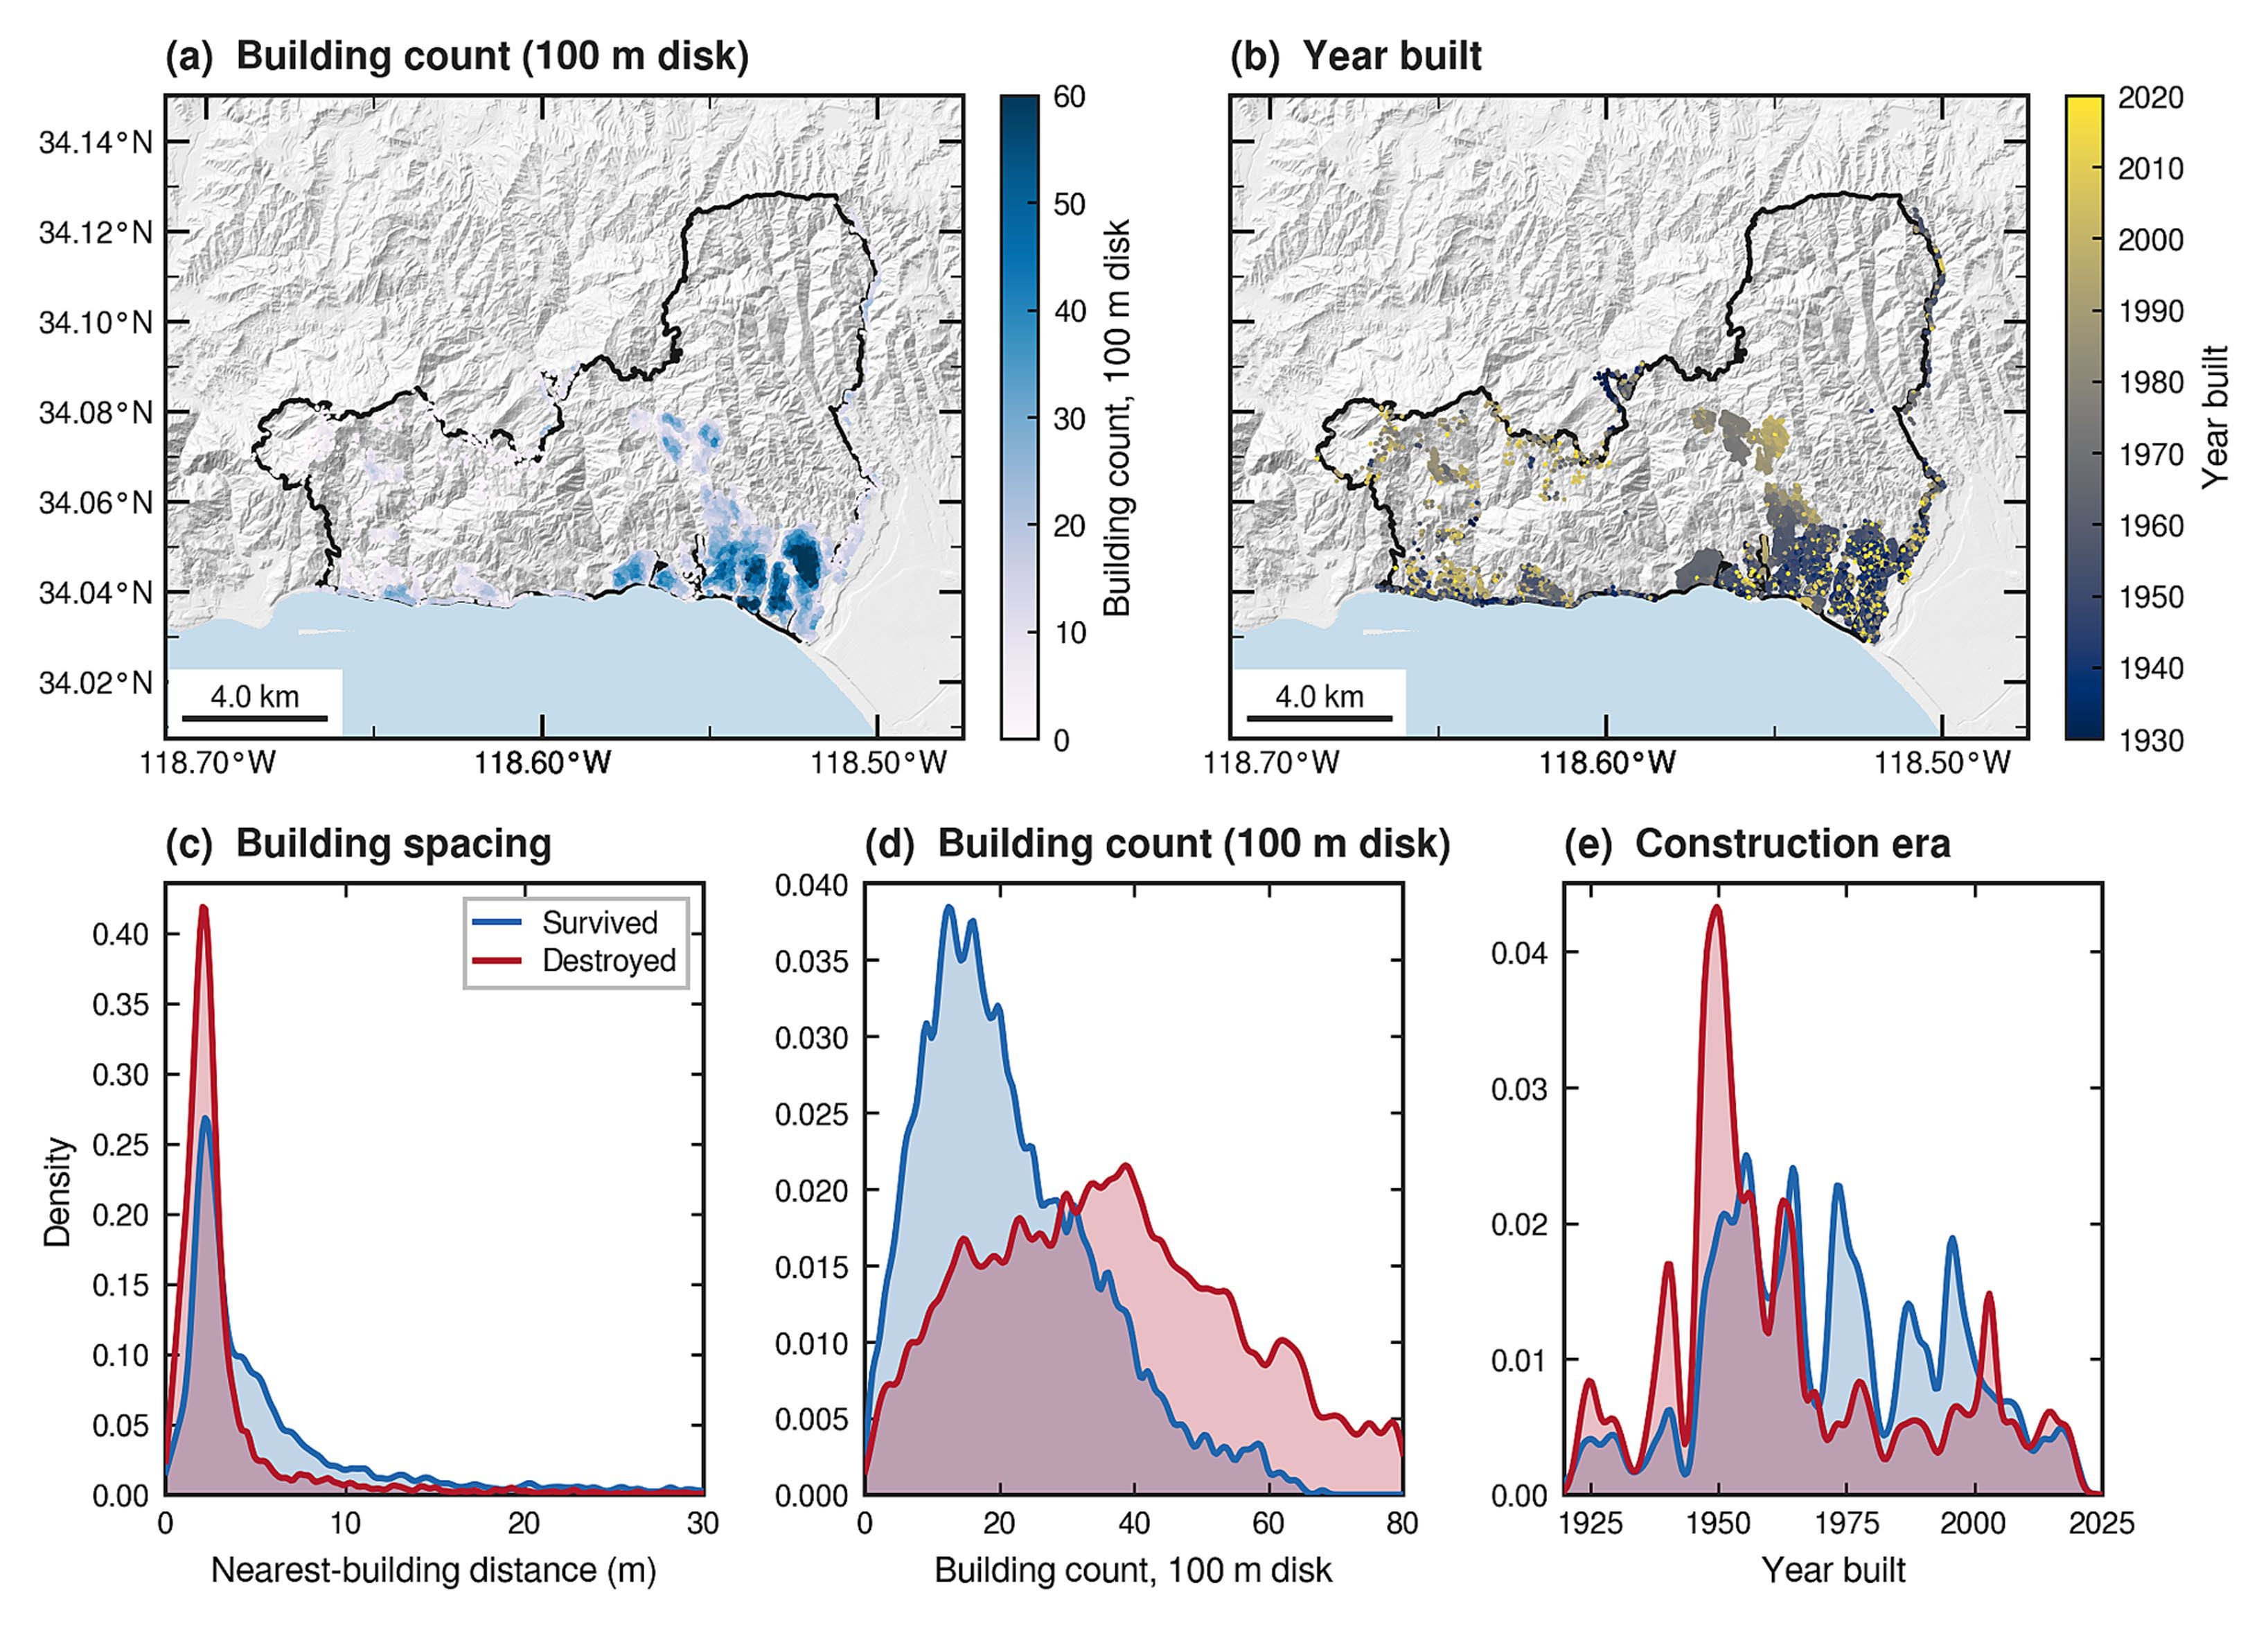
Mohammadreza Narimani Palisades Fire maps and densities of neighborhood building count, year built, and building spacing for survived versus destroyed structures
Figure 6. Built-environment context: neighborhood building count, construction era, and spacing for survived vs destroyed homes.
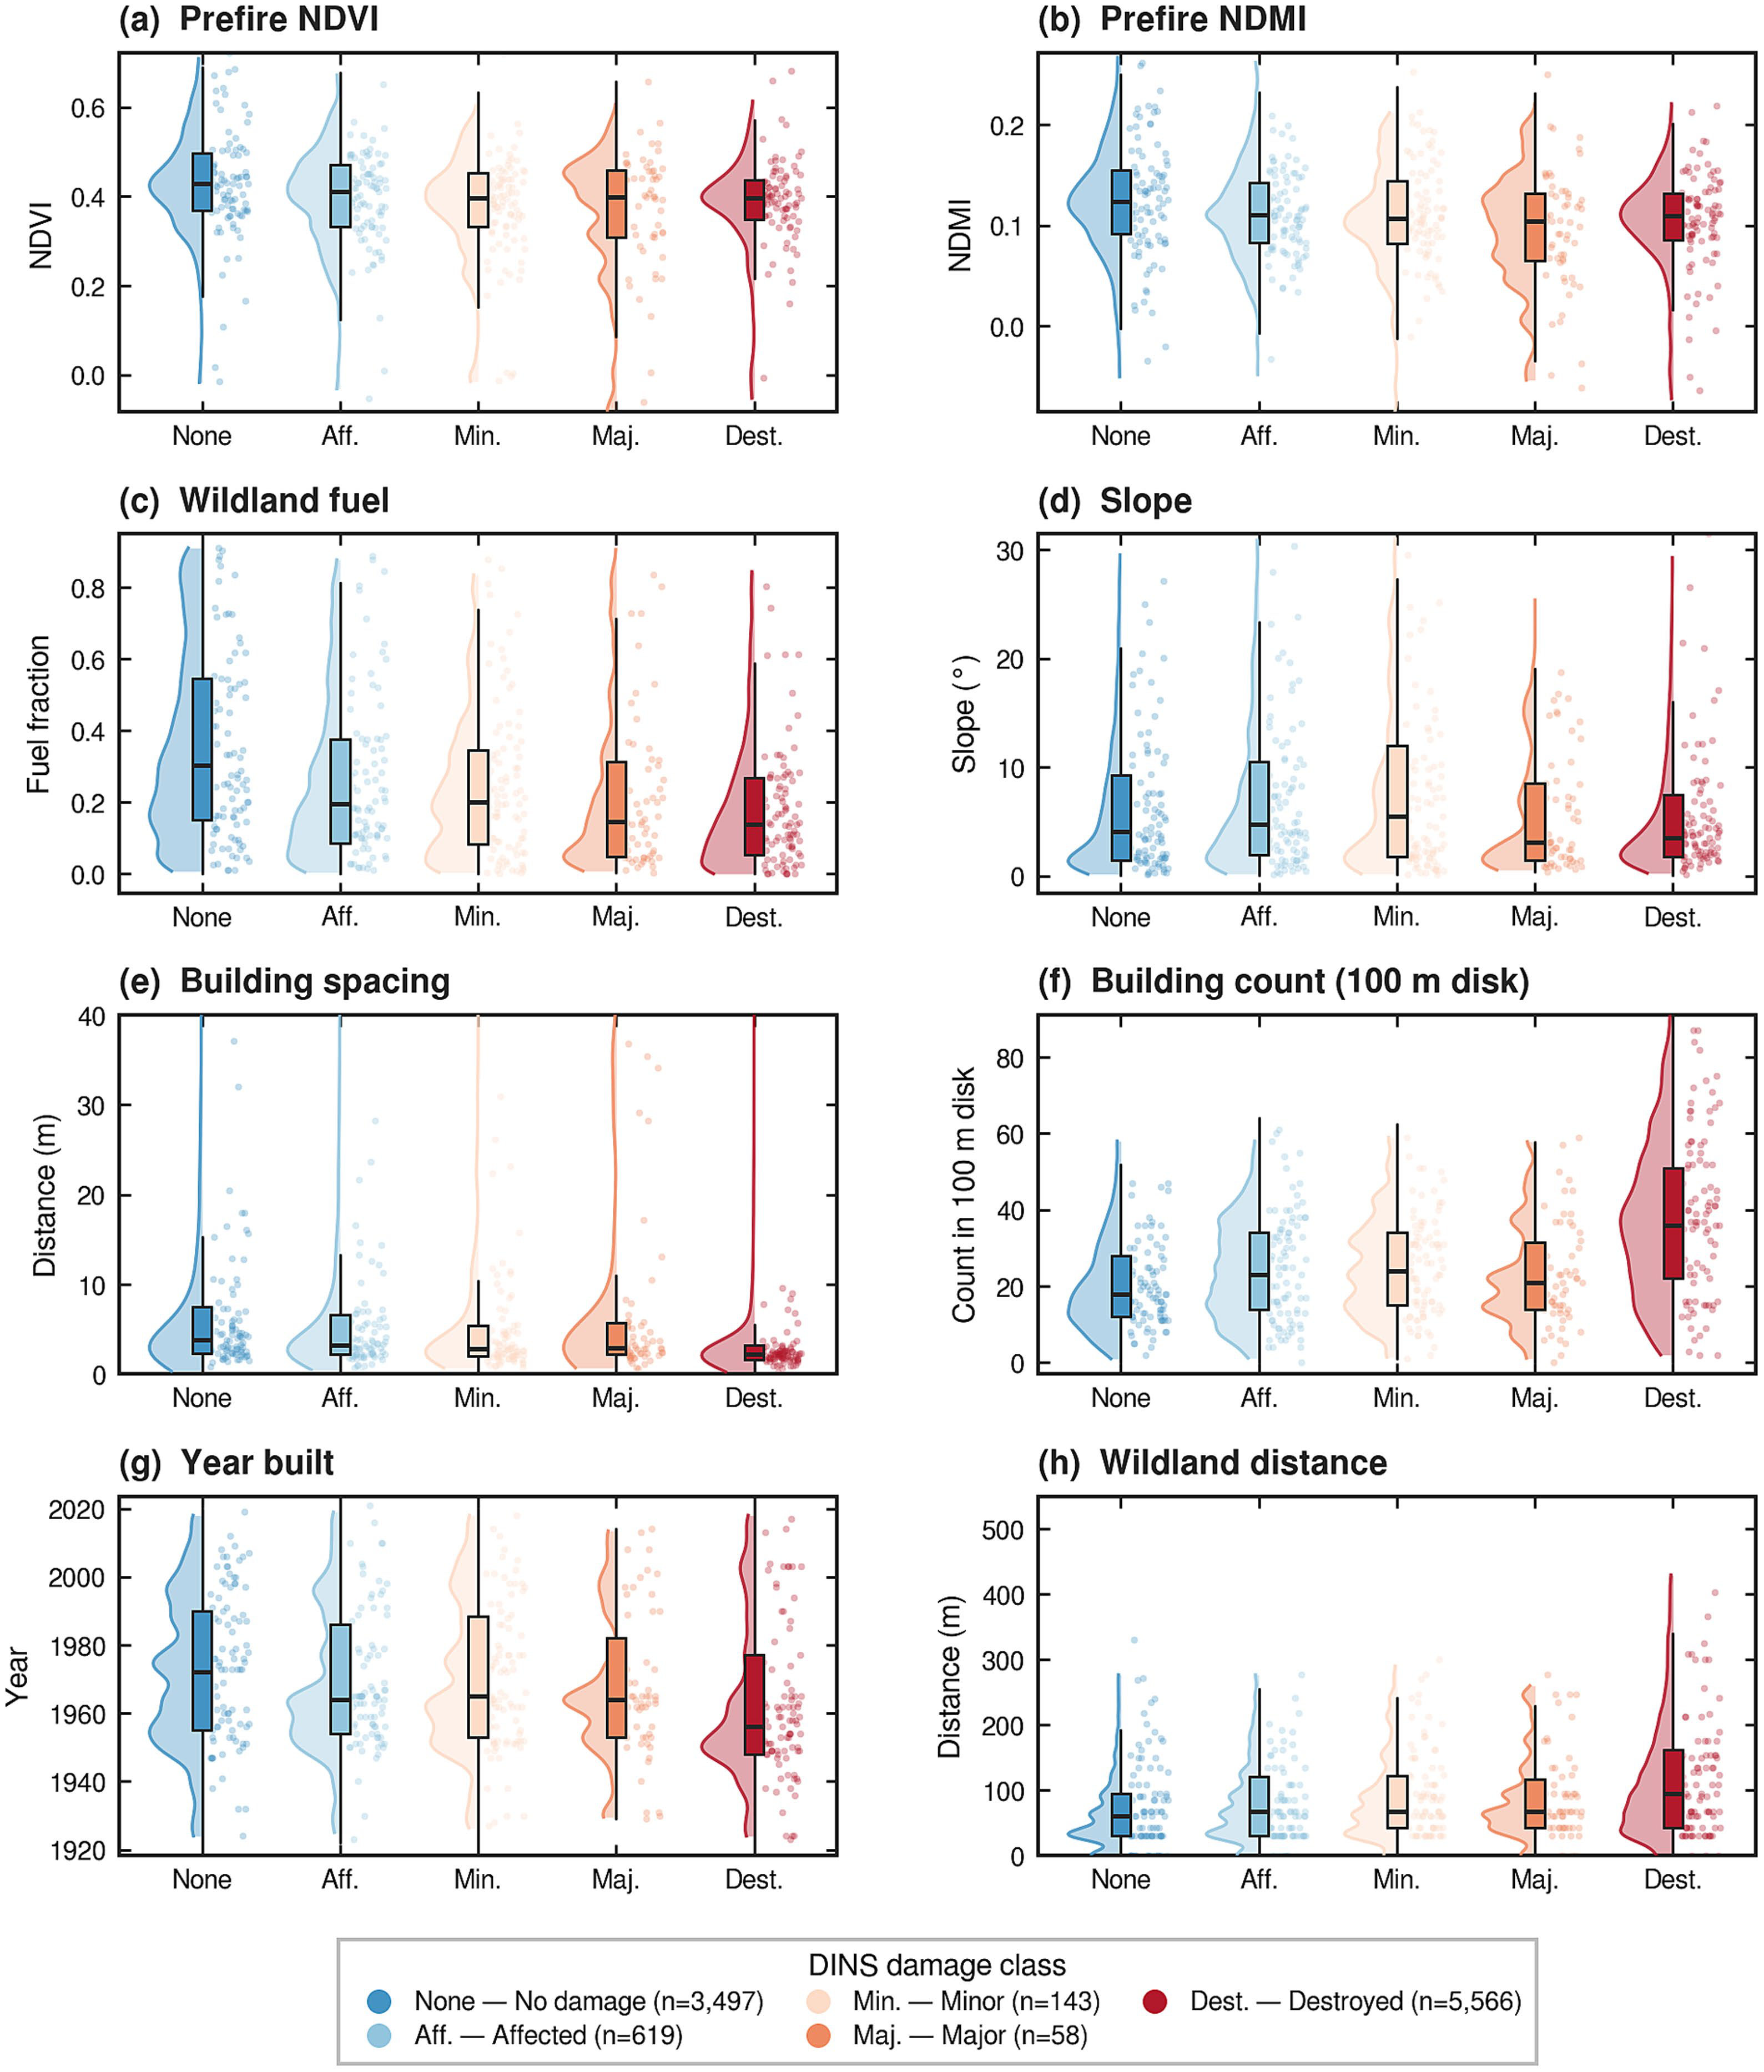
Mohammadreza Narimani Palisades pre-fire predictor violins by DINS damage class for NDVI, NDMI, fuels, slope, building spacing, building count, year built, and wildland distance
Figure 7. Pre-fire predictor distributions by original DINS damage class.

Spatial Validation Changes the Story

Random CV suggested excellent discrimination for the integrated gradient-boosting model (ROC-AUC 0.92). Spatial validation reduced that to 0.75. An interpretable logistic model reached a similar spatial AUC and had a calibration slope closer to one. The paper therefore treats the workflow as a neighborhood-scale screening tool, not a parcel-level prediction system.
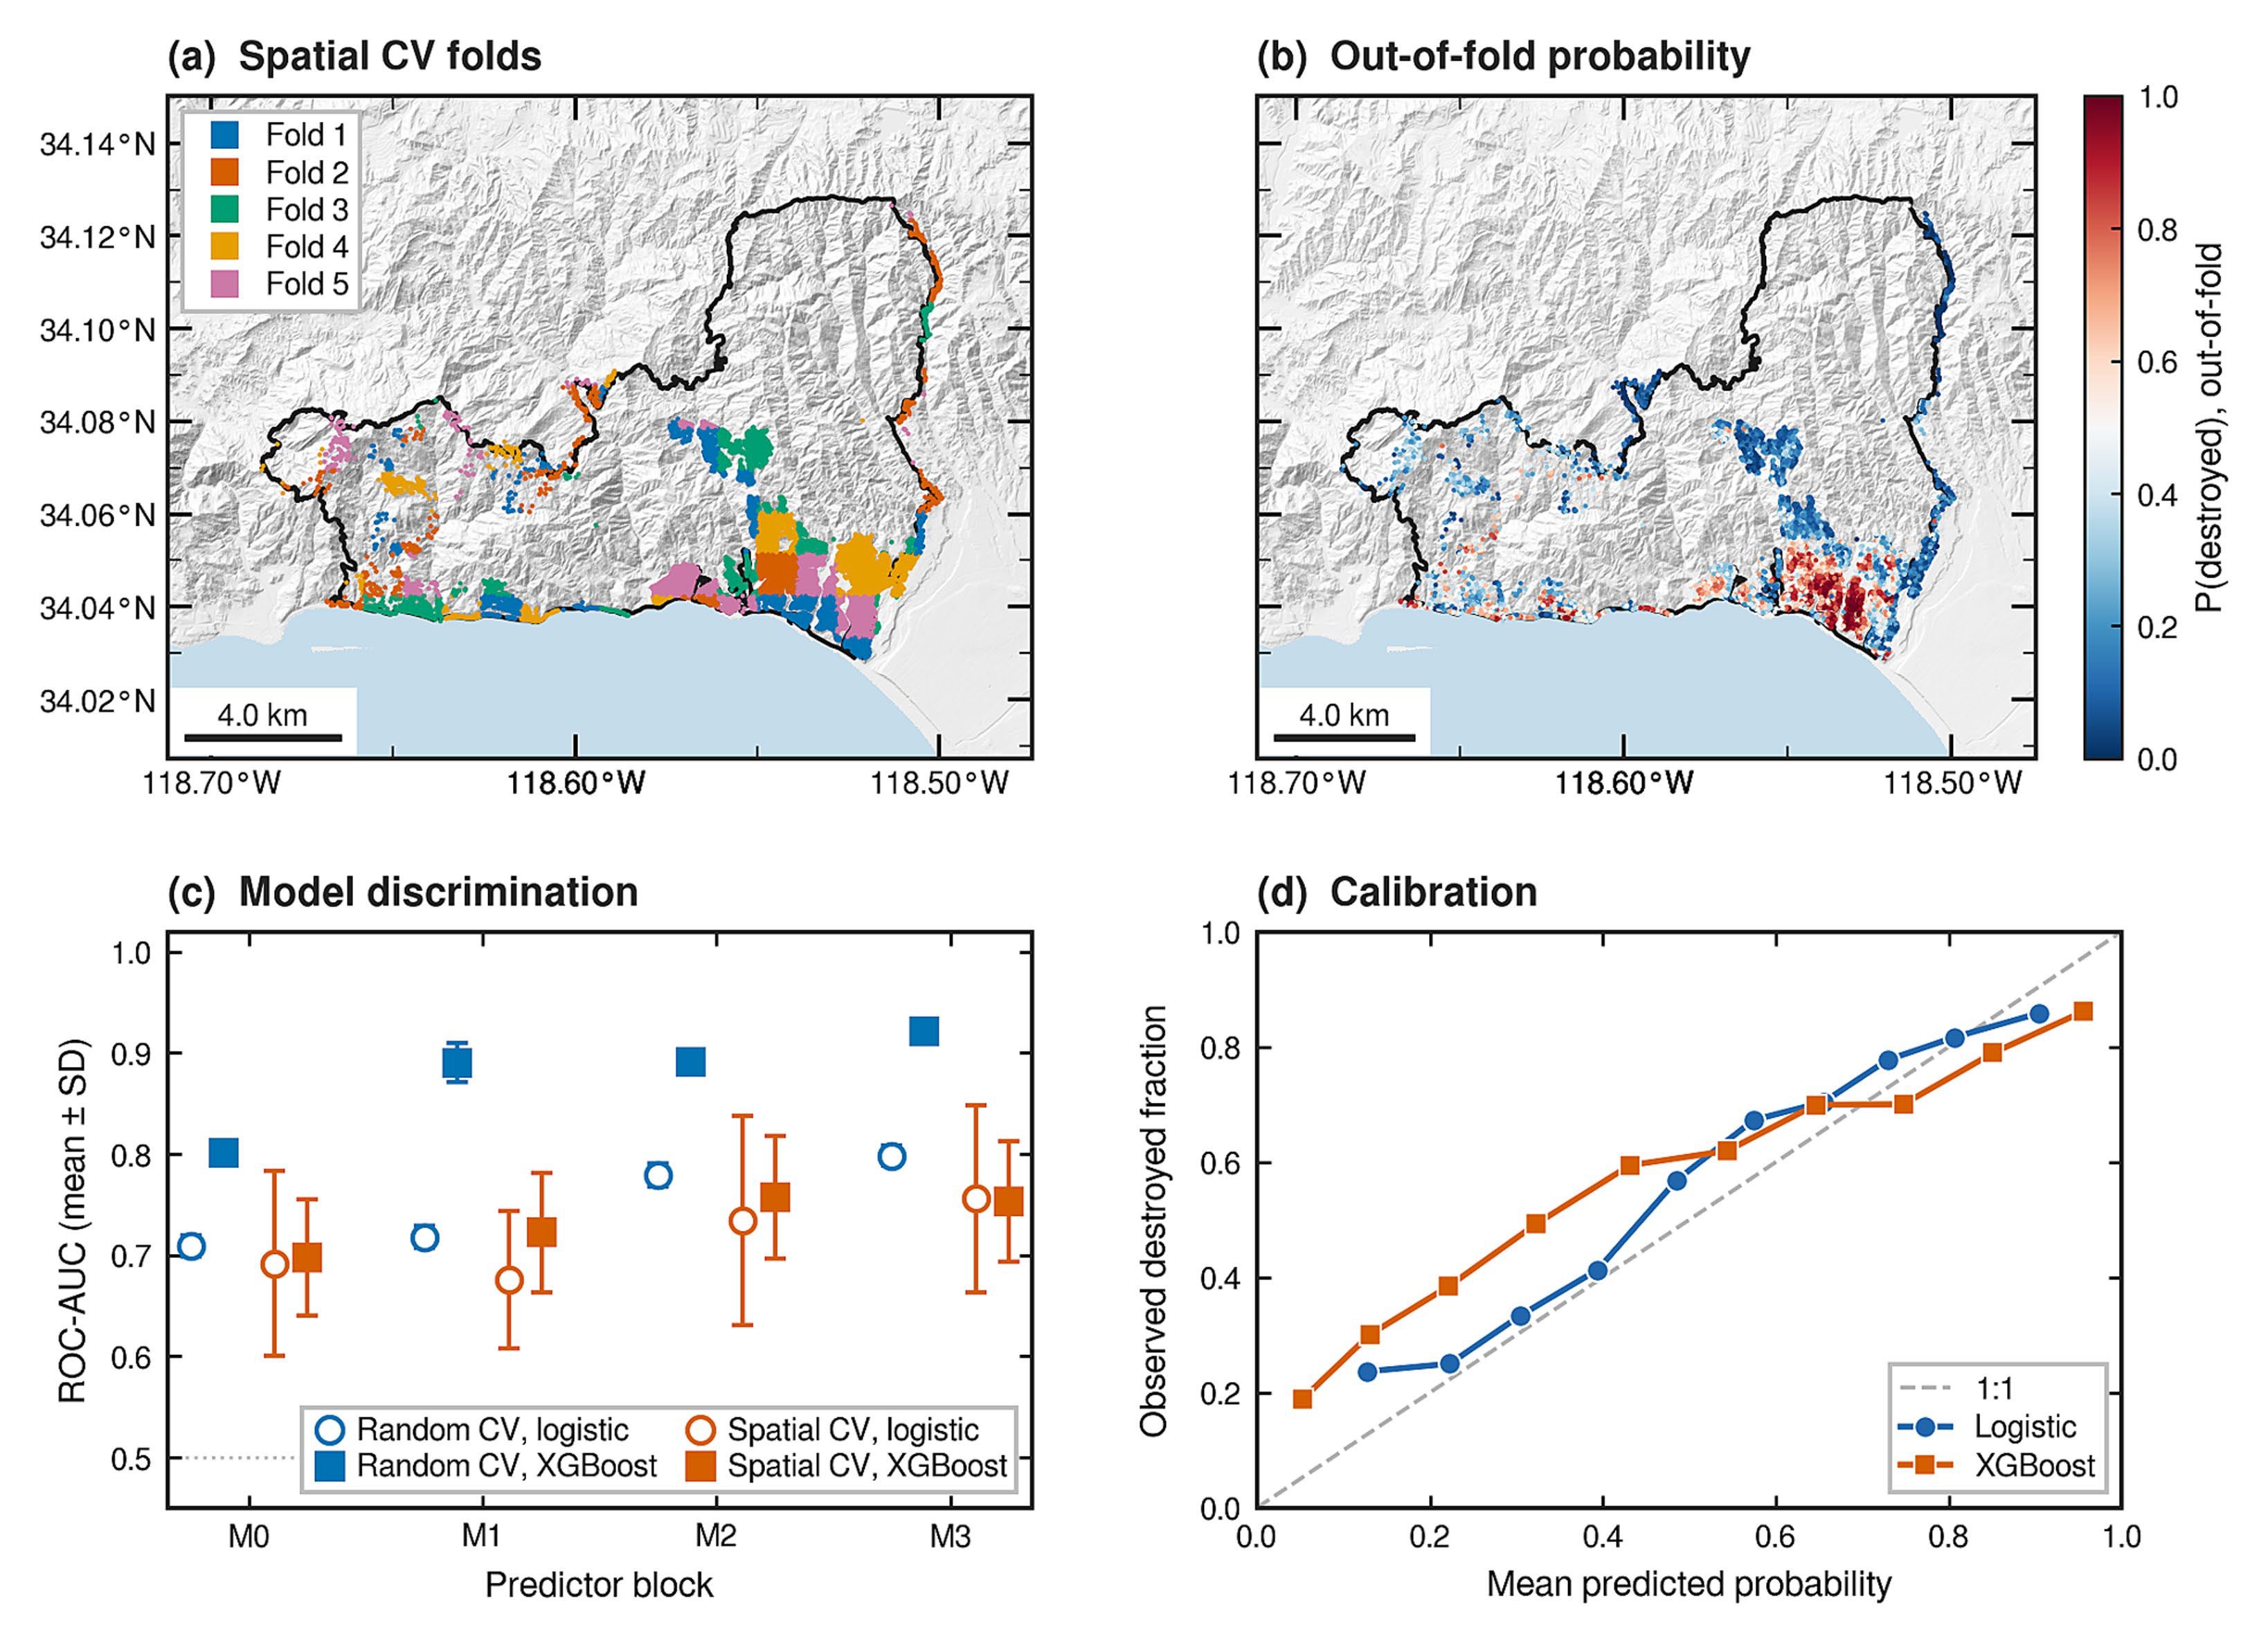
Mohammadreza Narimani Palisades GeoAI spatial cross-validation folds, out-of-fold destruction probability map, ROC-AUC comparison of logistic and XGBoost, and calibration curves
Figure 8. Spatial-block CV, out-of-fold probabilities, discrimination, and calibration for logistic vs XGBoost models.
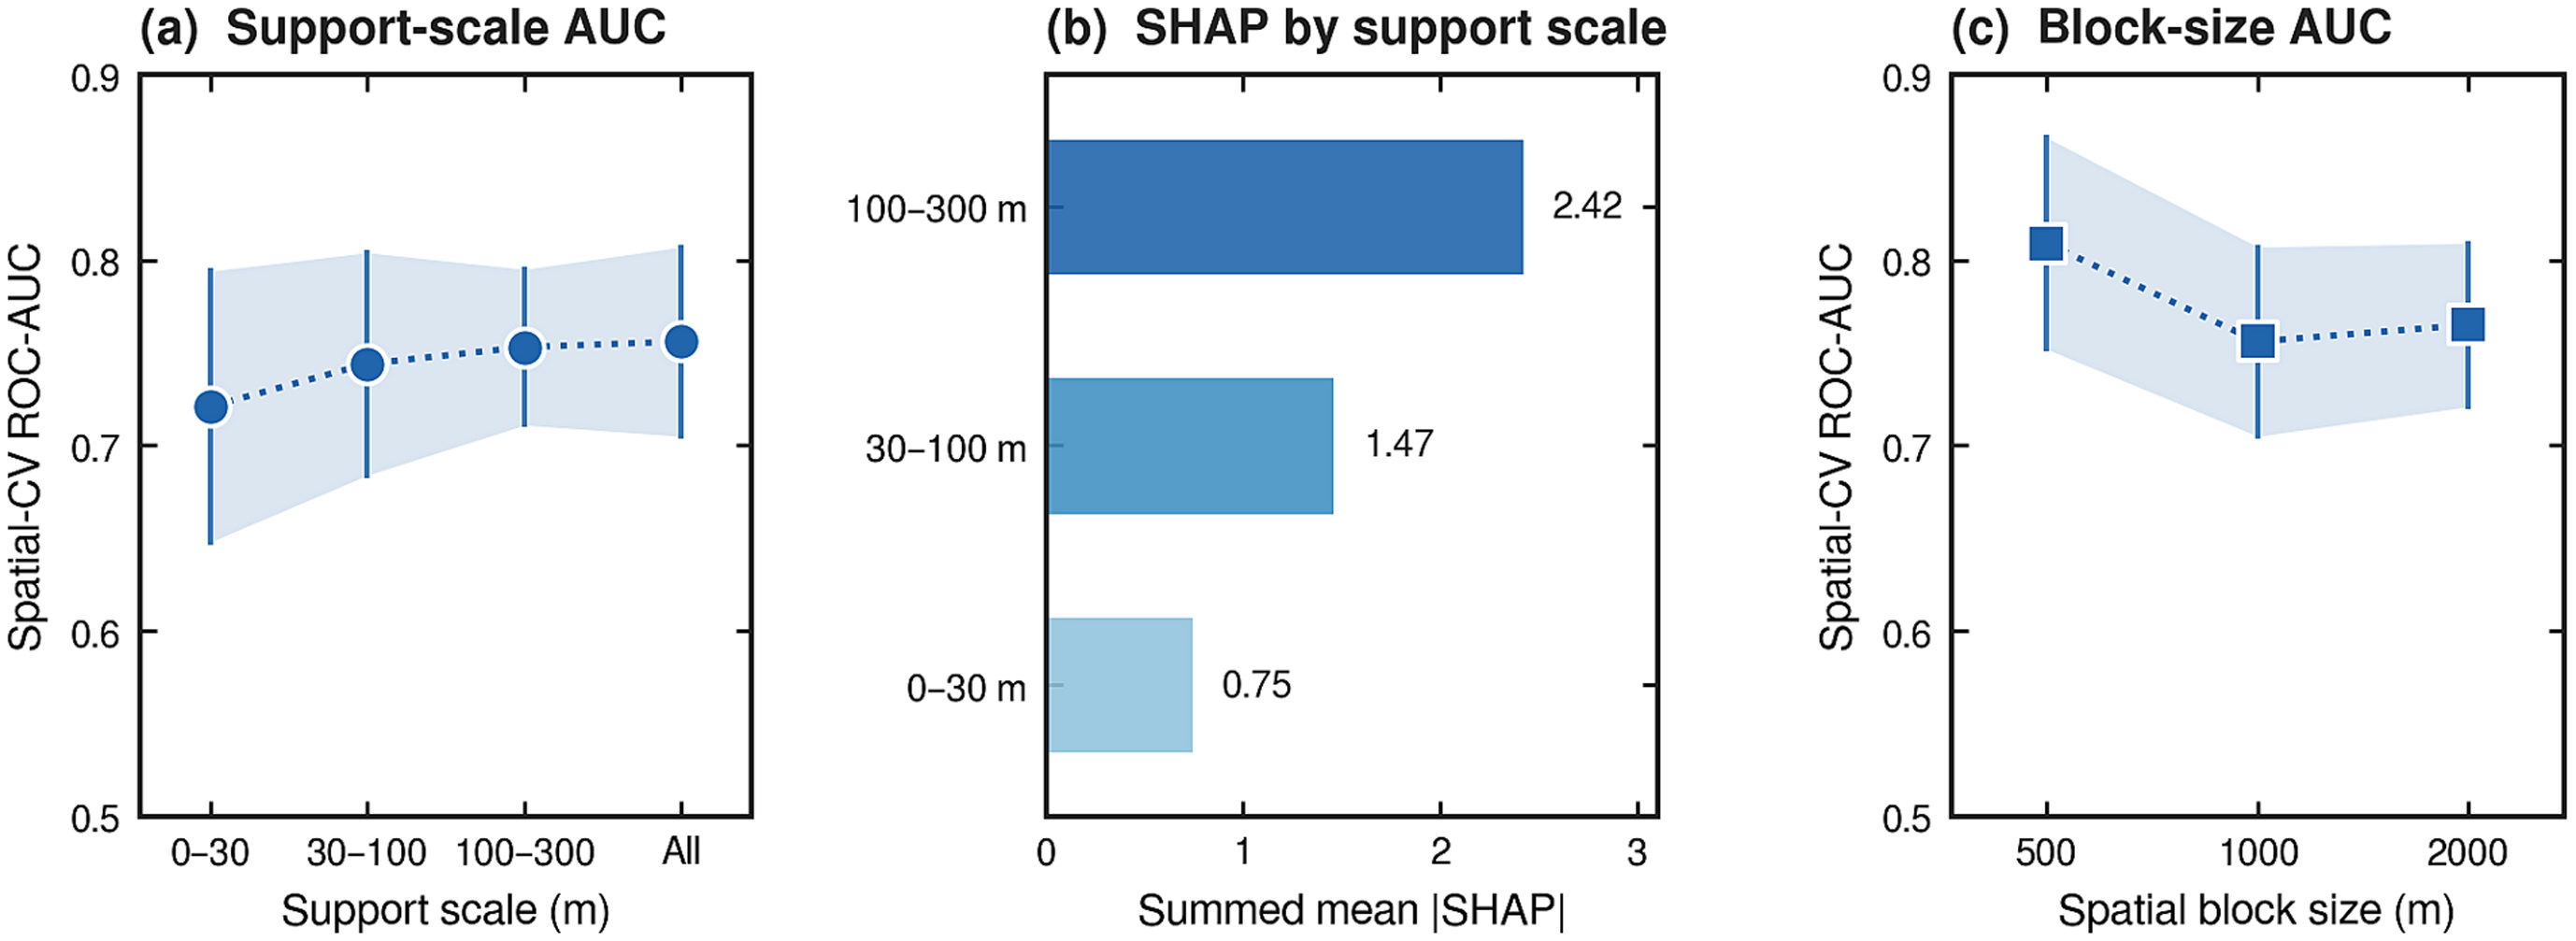
Mohammadreza Narimani Palisades GeoAI sensitivity of XGBoost ROC-AUC and SHAP to neighborhood support scale and spatial block width
Figure 9. Support-scale and block-size sensitivities of fixed-settings XGBoost.
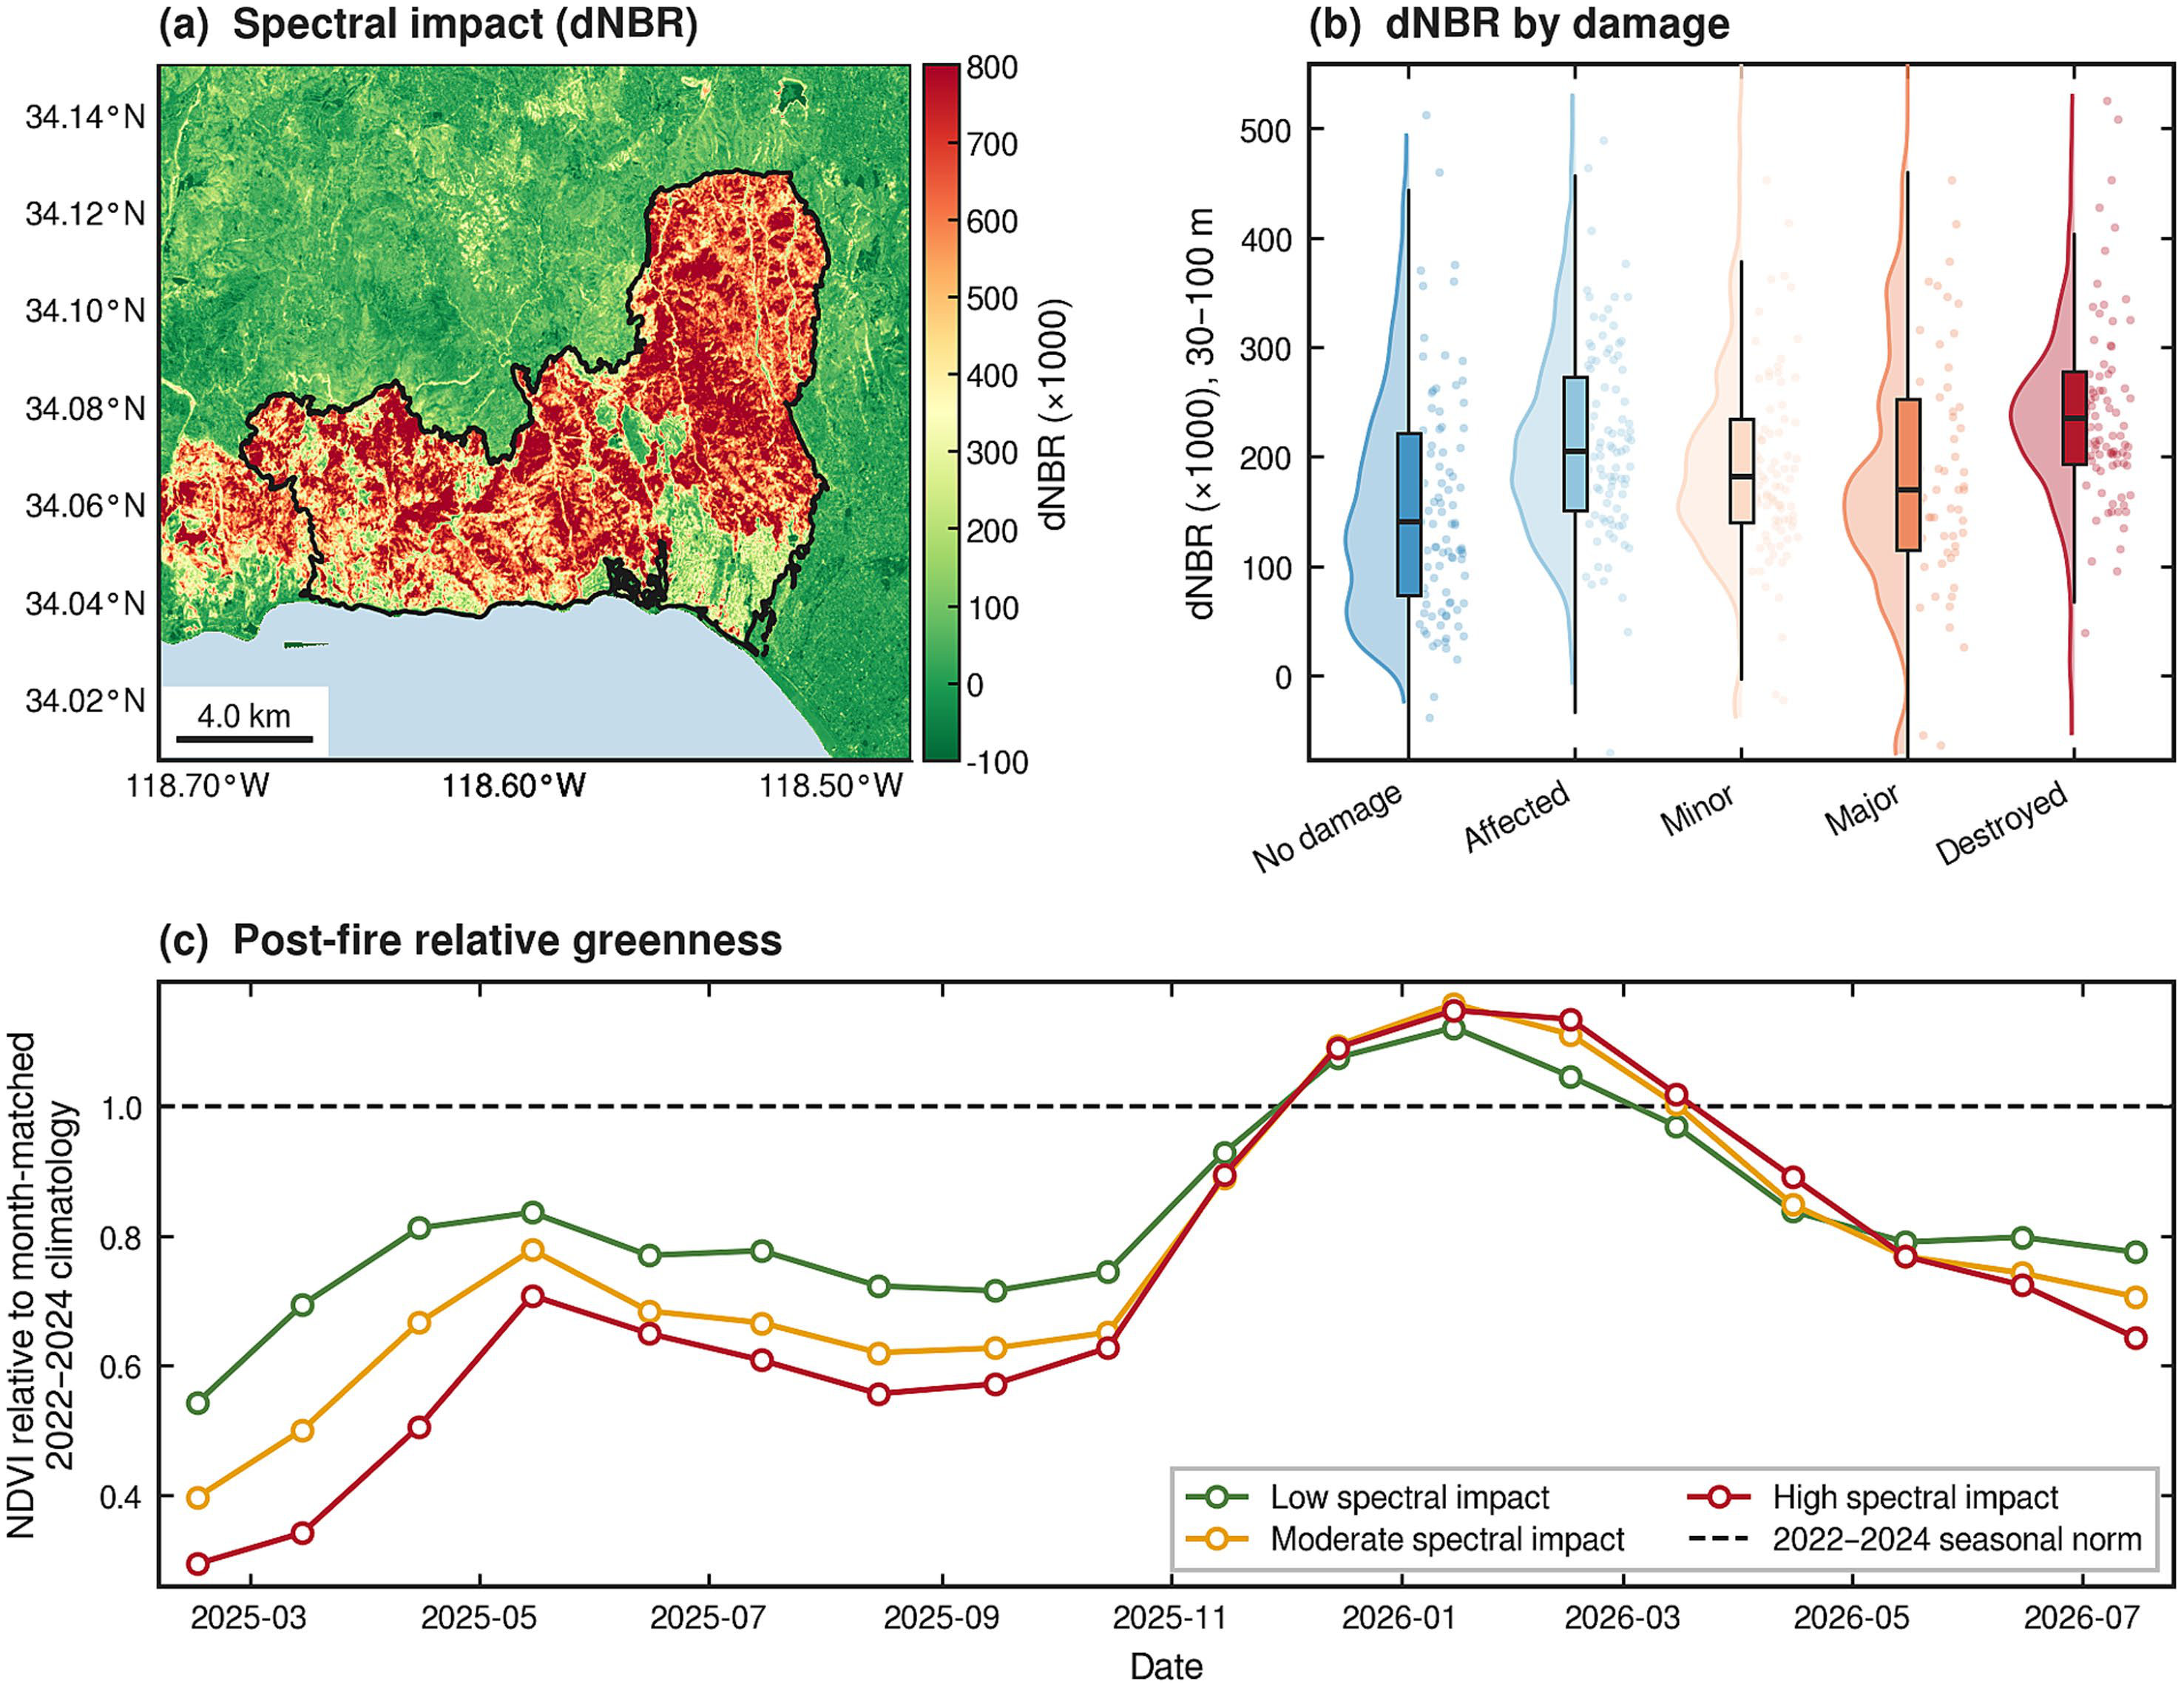
Mohammadreza Narimani Palisades post-fire dNBR spectral impact and class-level NDVI relative to 2022-2024 reference composites
Figure 10. Spectral impact (dNBR) and aggregate post-fire relative greenness versus month-matched 2022–2024 references.
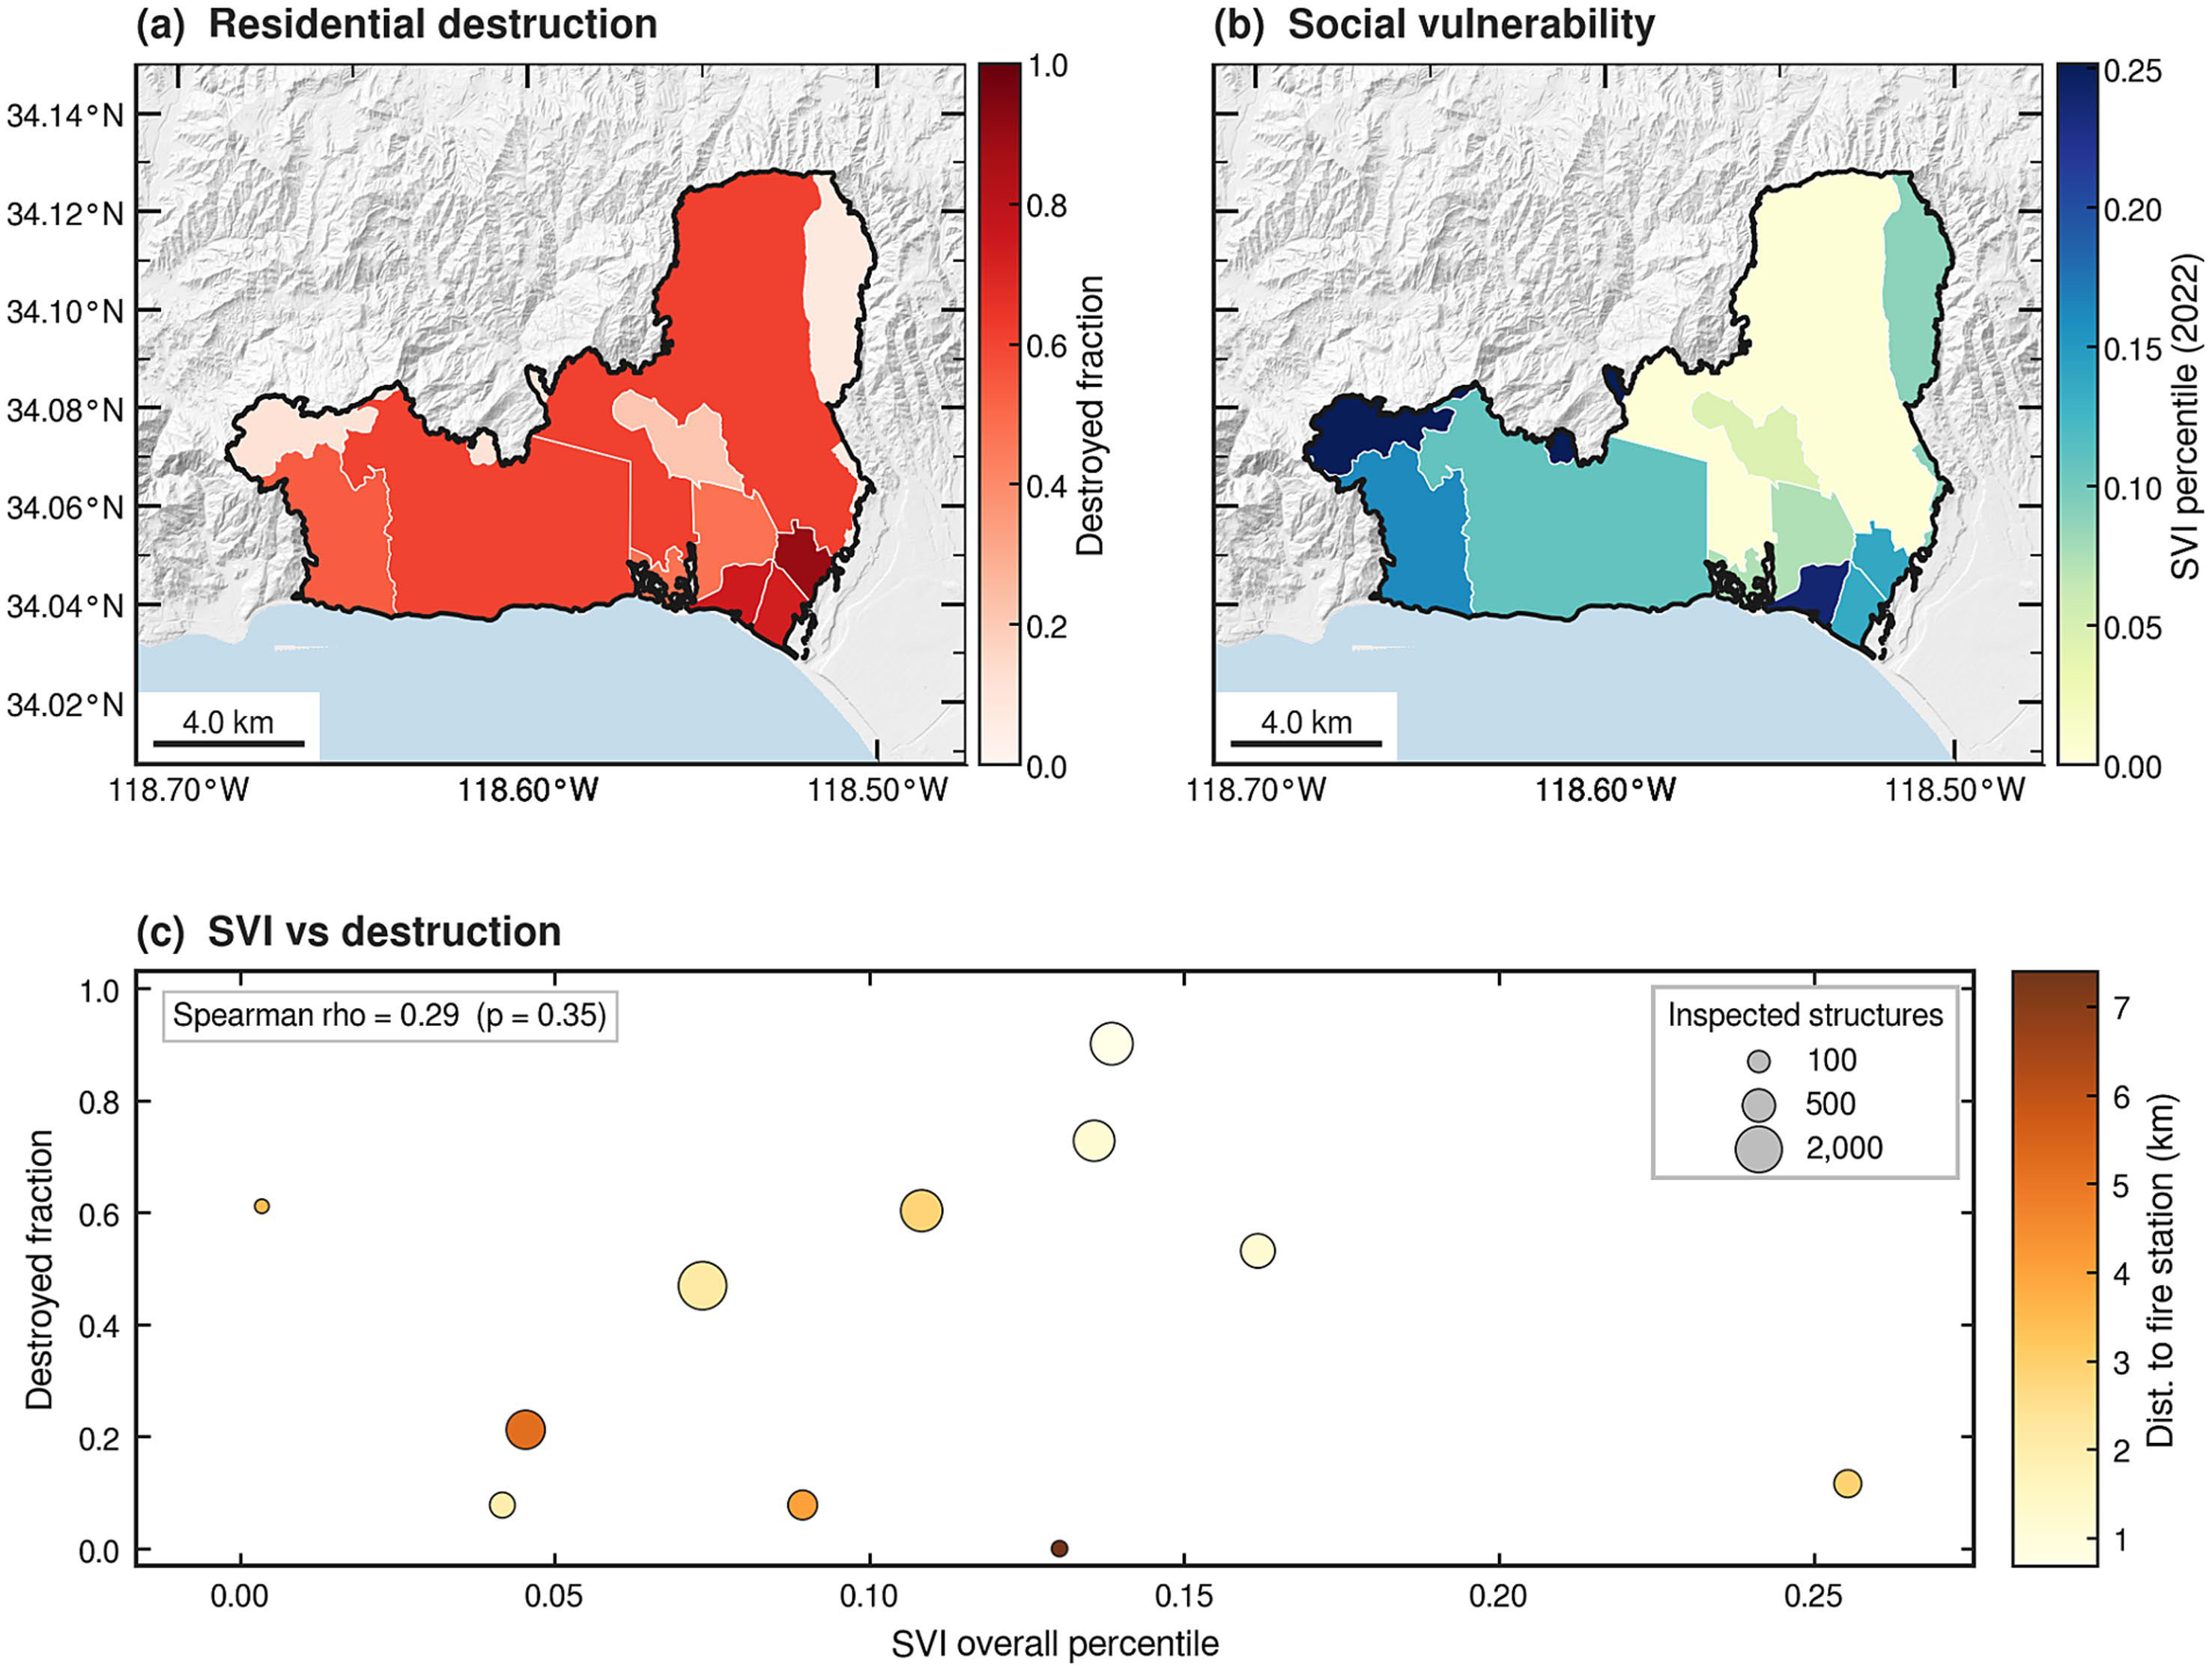
Mohammadreza Narimani Palisades community context maps of residential destruction fraction, CDC SVI 2022, and tract-level SVI versus destruction
Figure 11. Community context: tract-level residential destruction, CDC/ATSDR SVI 2022, and SVI versus destruction.
Takeaway: report spatial validation and probability diagnostics alongside prediction maps. Applying these coefficients to another fire still requires independent-event validation.

Paper and Citation

Farajpoor, P., & Narimani, M. (2026). Explainable GeoAI for urban wildfire structure loss: vegetation and built environment in the 2025 palisades fire. Frontiers in Sustainability, 7, 1975724.

DOI: 10.3389/frsus.2026.1975724 · Open access under CC BY 4.0

Please cite the publisher version when you use this work. The summary on this page is a research card, not a substitute for the article.

Contact

Mohammadreza Narimani
PhD Candidate, University of California, Davis

📧 mnarimani@ucdavis.edu  |  🎓 Google Scholar