🍇 Multi-Trait Spectral Modeling of Grapevine Leaf Traits and Nutrients

Parastoo Farajpoor, Alireza Pourreza*, Mohammadreza Narimani, Ashraf El-Kereamy, and Matthew W. Fidelibus

Plant Phenomics · Volume 7 · Article 100142 · 2025 · Open access CC BY

Digital Agriculture Laboratory · University of California, Davis · University of California, Riverside

From Leaf Spectra to Vineyard Traits

Hemispherical leaf reflectance encodes biochemistry and mineral nutrition. If those signals can be inverted reliably, growers gain a path to denser, less destructive vineyard monitoring. This Plant Phenomics study collects hyperspectral data from about 1,000 grapevine leaves across three seasons (400–2500 nm) and compares single-trait versus multi-trait deep models.

Missing structural and pigment labels were imputed with PROSPECT-PRO in inverse mode, with a chlorophyll bias correction. Spectra were reduced from 2,101 bands to 204 correlated-band groups. Both model families use a hybrid CNN–LSTM; the multi-trait network predicts all 16 traits at once and weights measured versus imputed samples during training.
Core story: predicting grapevine traits together, rather than one at a time, uses shared spectral structure and inter-trait dependence—and lifts nitrogen, phosphorus, Nstruct, and manganese in particular.
~1,000Grapevine leaves
16Traits in one model
204Merged spectral bands
0.42 / 0.81N / P R² (multi-trait)
0.90 / 0.62Nstruct / Mn R²
CC BYOpen-access license
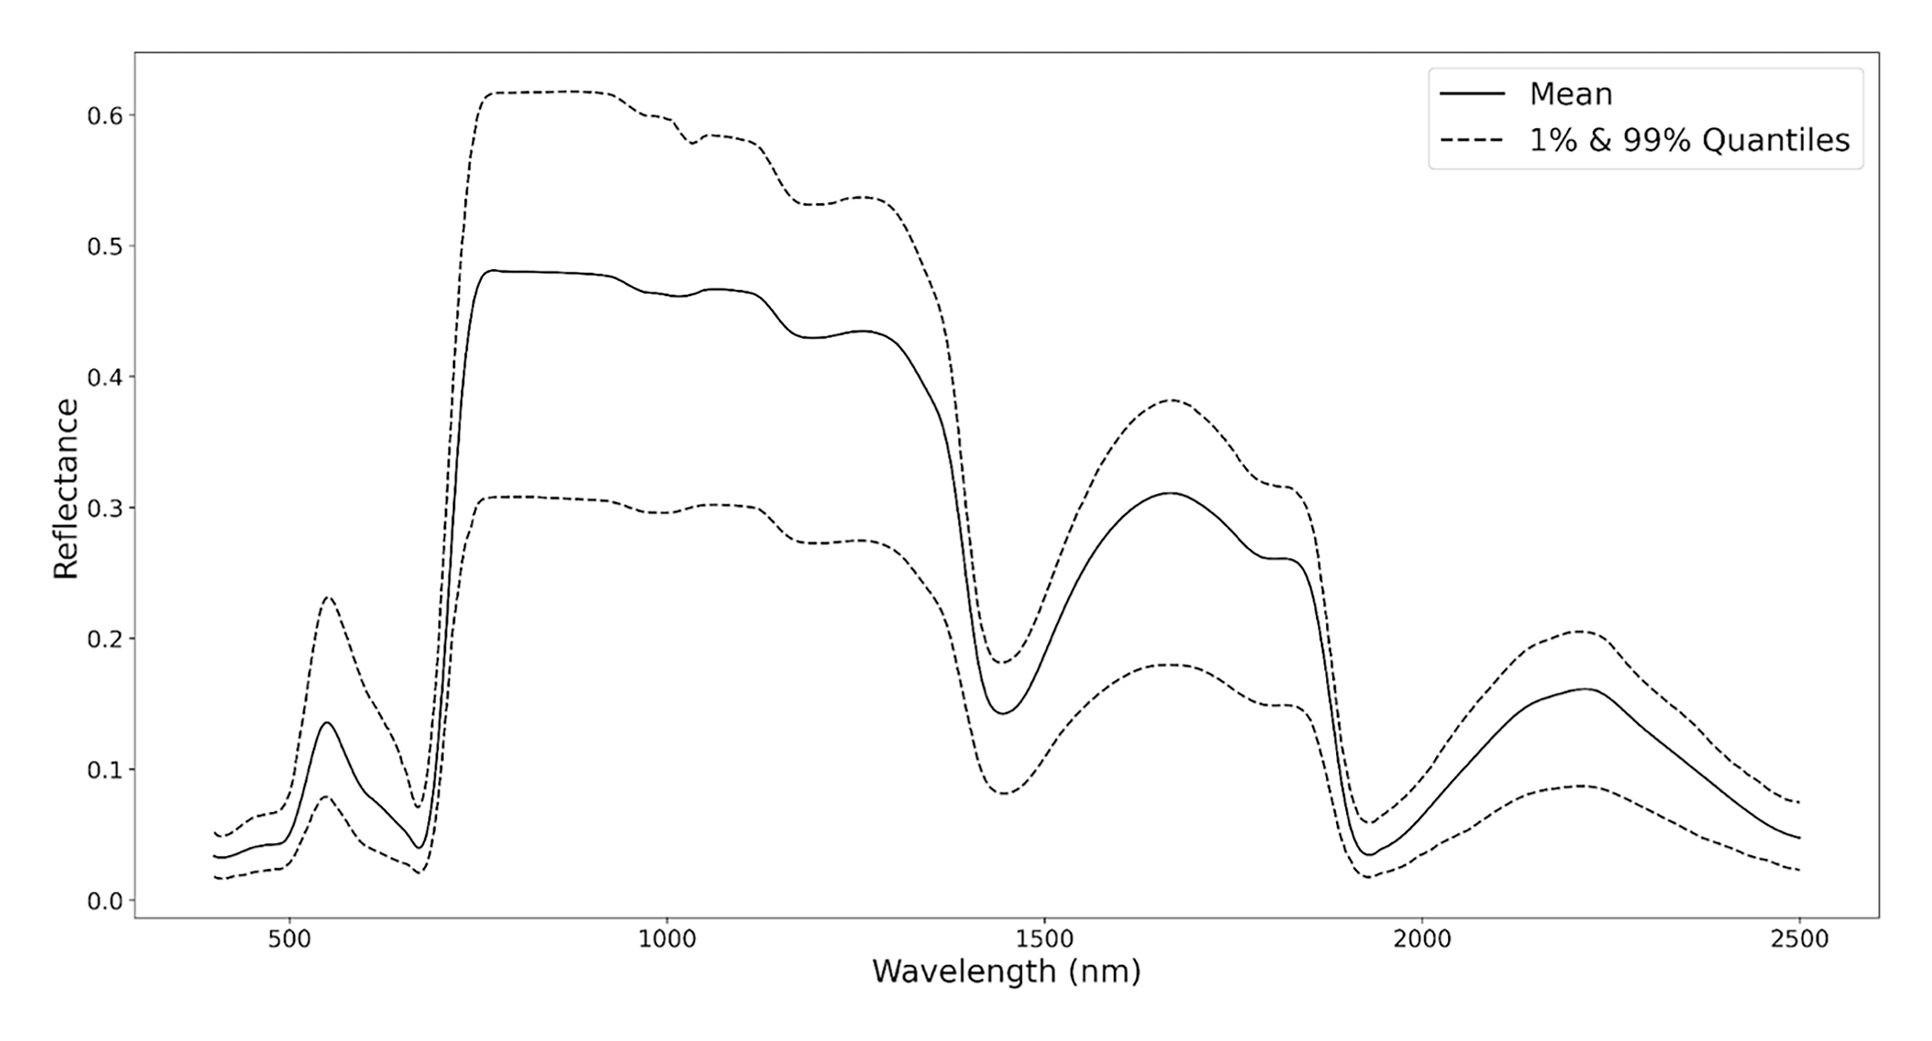
Mohammadreza Narimani grapevine leaf spectral reflectance mean and 1 to 99 percent quantiles from 400 to 2500 nm
Figure 1. Mean grapevine leaf reflectance with 1% and 99% quantiles across the full solar-reflective range.

PROSPECT Correction and Multi-Trait Gains

Inverse PROSPECT-PRO chlorophyll was systematically high. A slope-based correction (scale 0.75 on the comparable subset) aligned distributions with wet-lab chlorophyll before those labels entered the trait models.
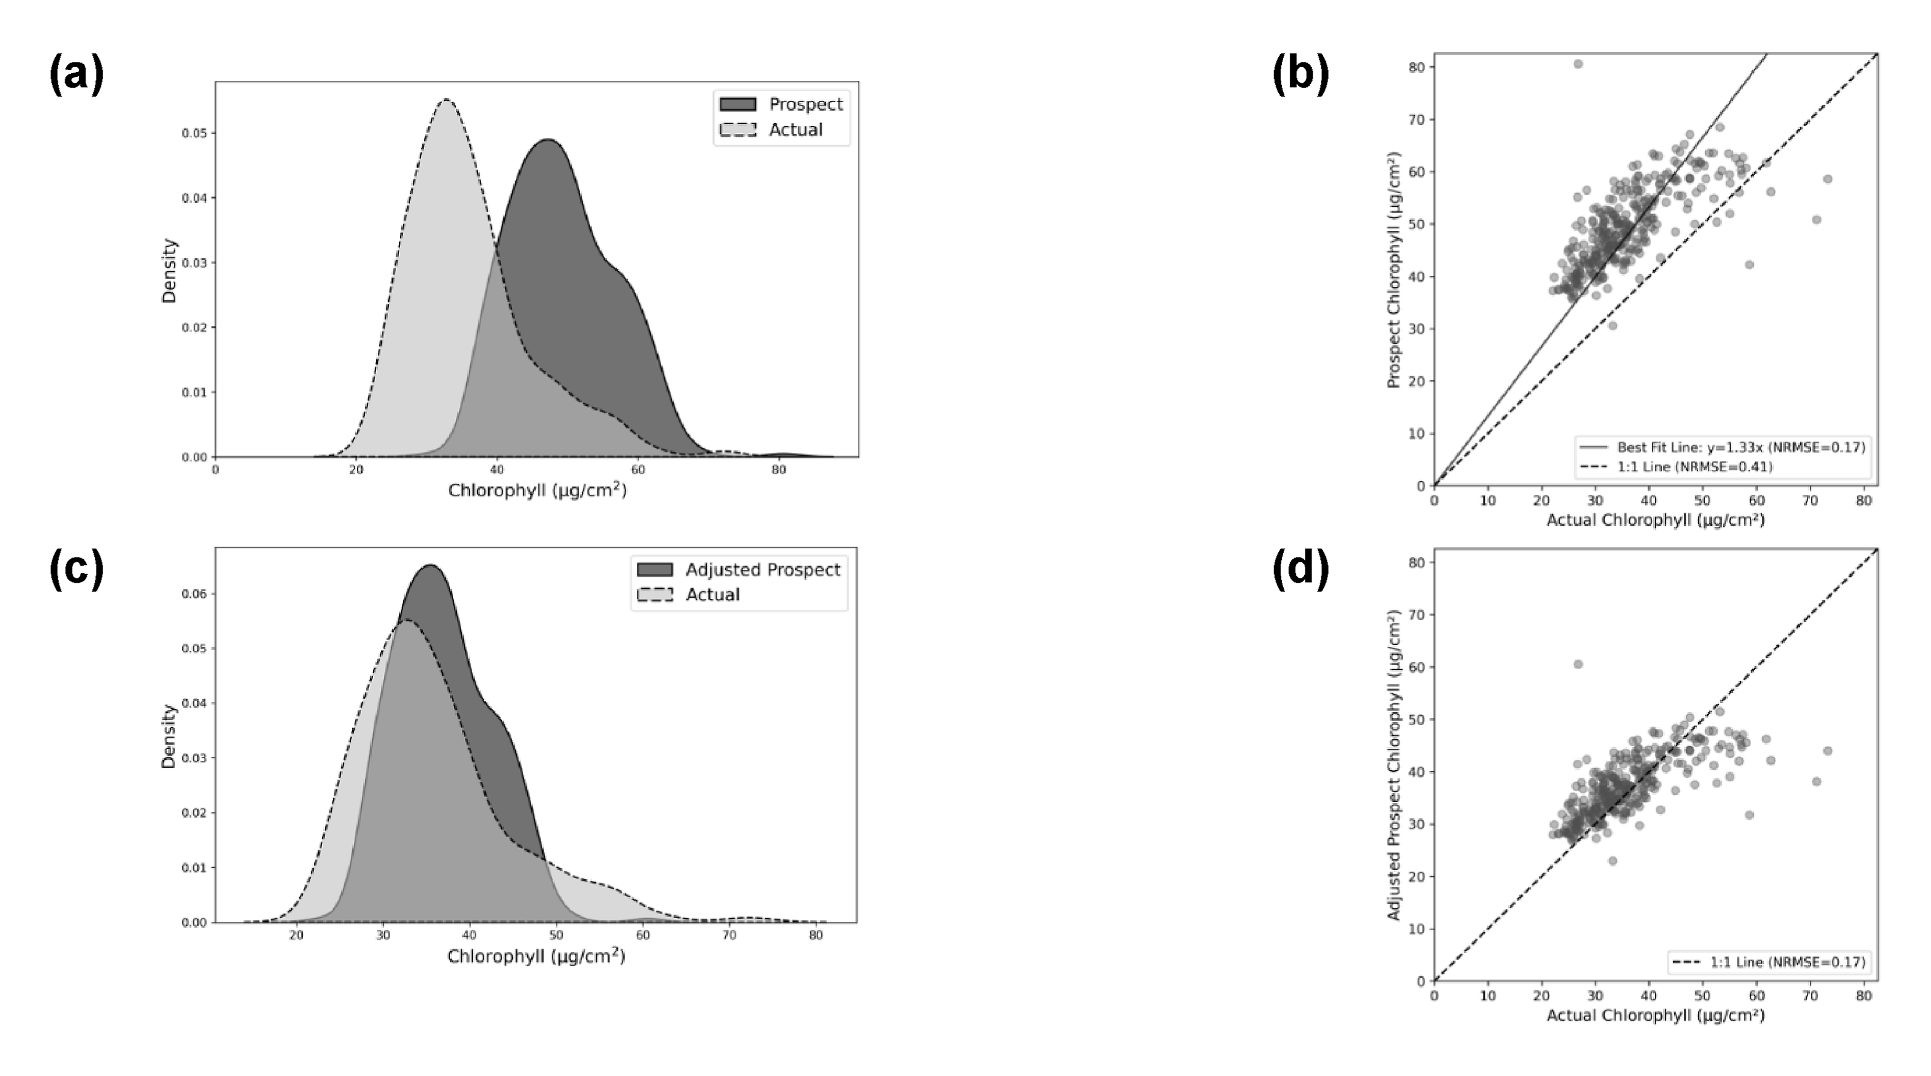
Mohammadreza Narimani comparison of PROSPECT-PRO chlorophyll estimates versus laboratory grapevine leaf chlorophyll before and after bias correction
Figure 2. PROSPECT-PRO chlorophyll versus laboratory values, before and after the bias correction.

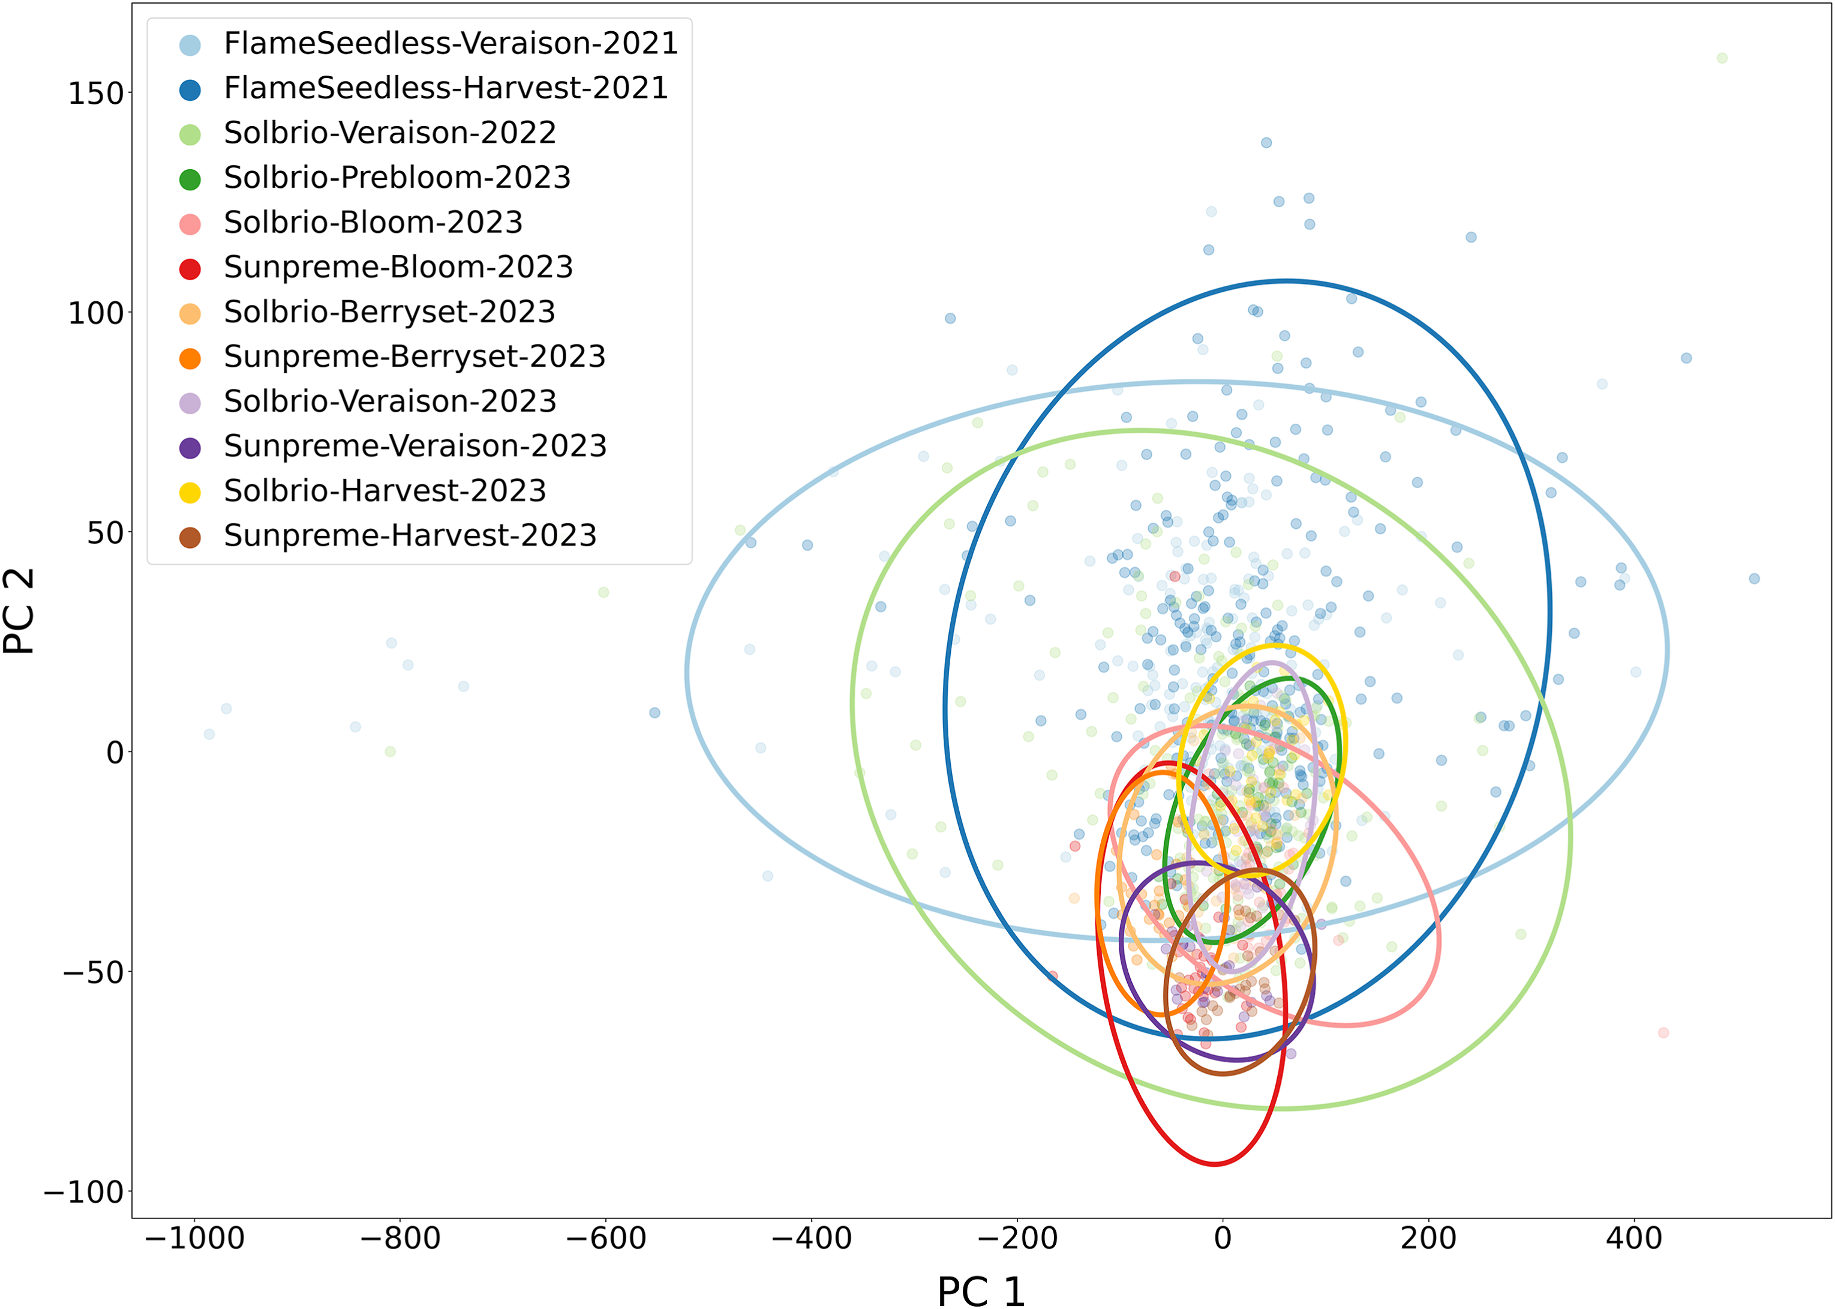
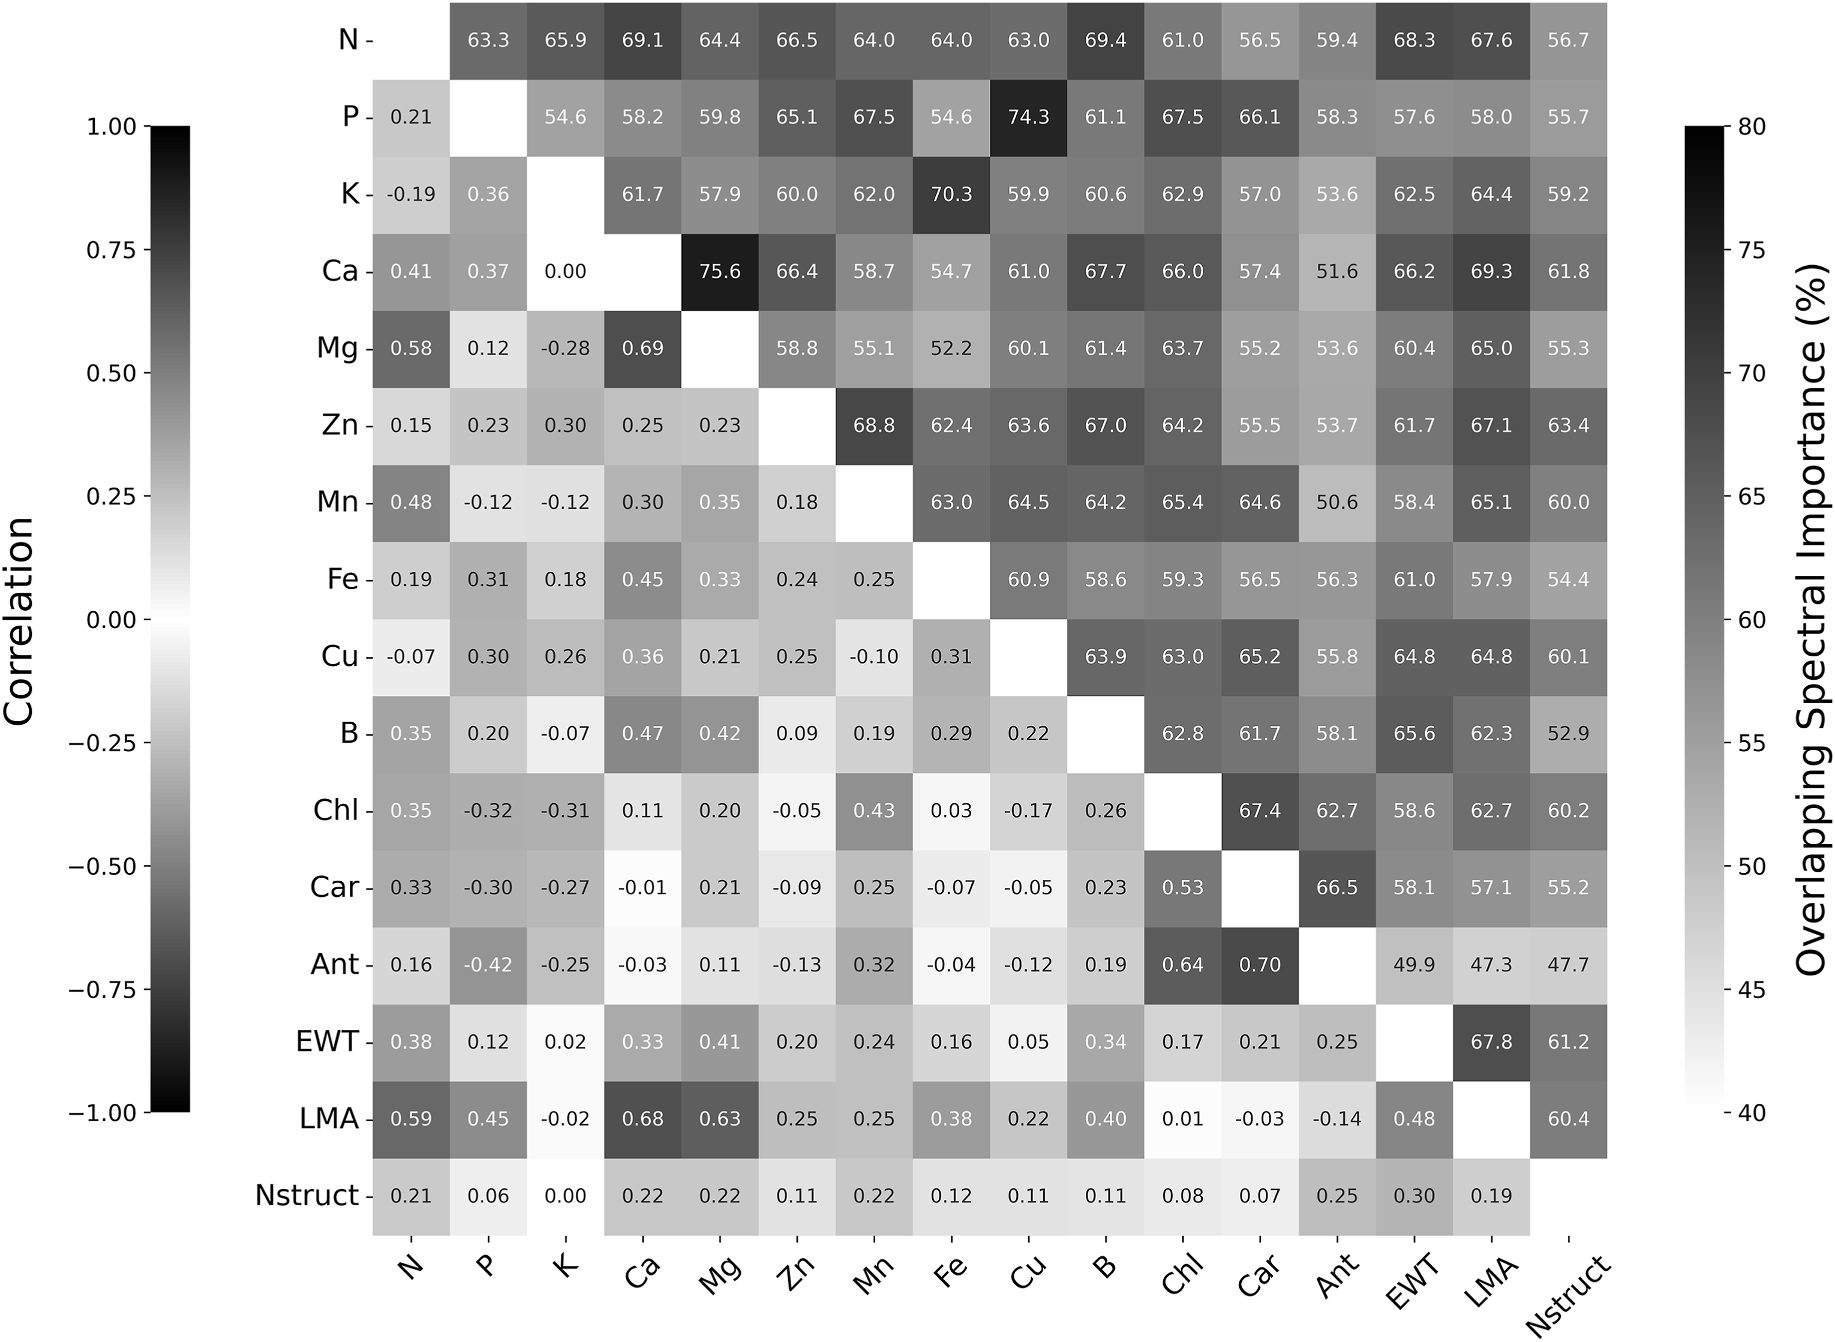
Wavelength importance, trait–trait correlation, and PCA of the merged spectra explain why a shared backbone helps: nutrients and pigments reuse overlapping bands, while phenology still separates in PC space.
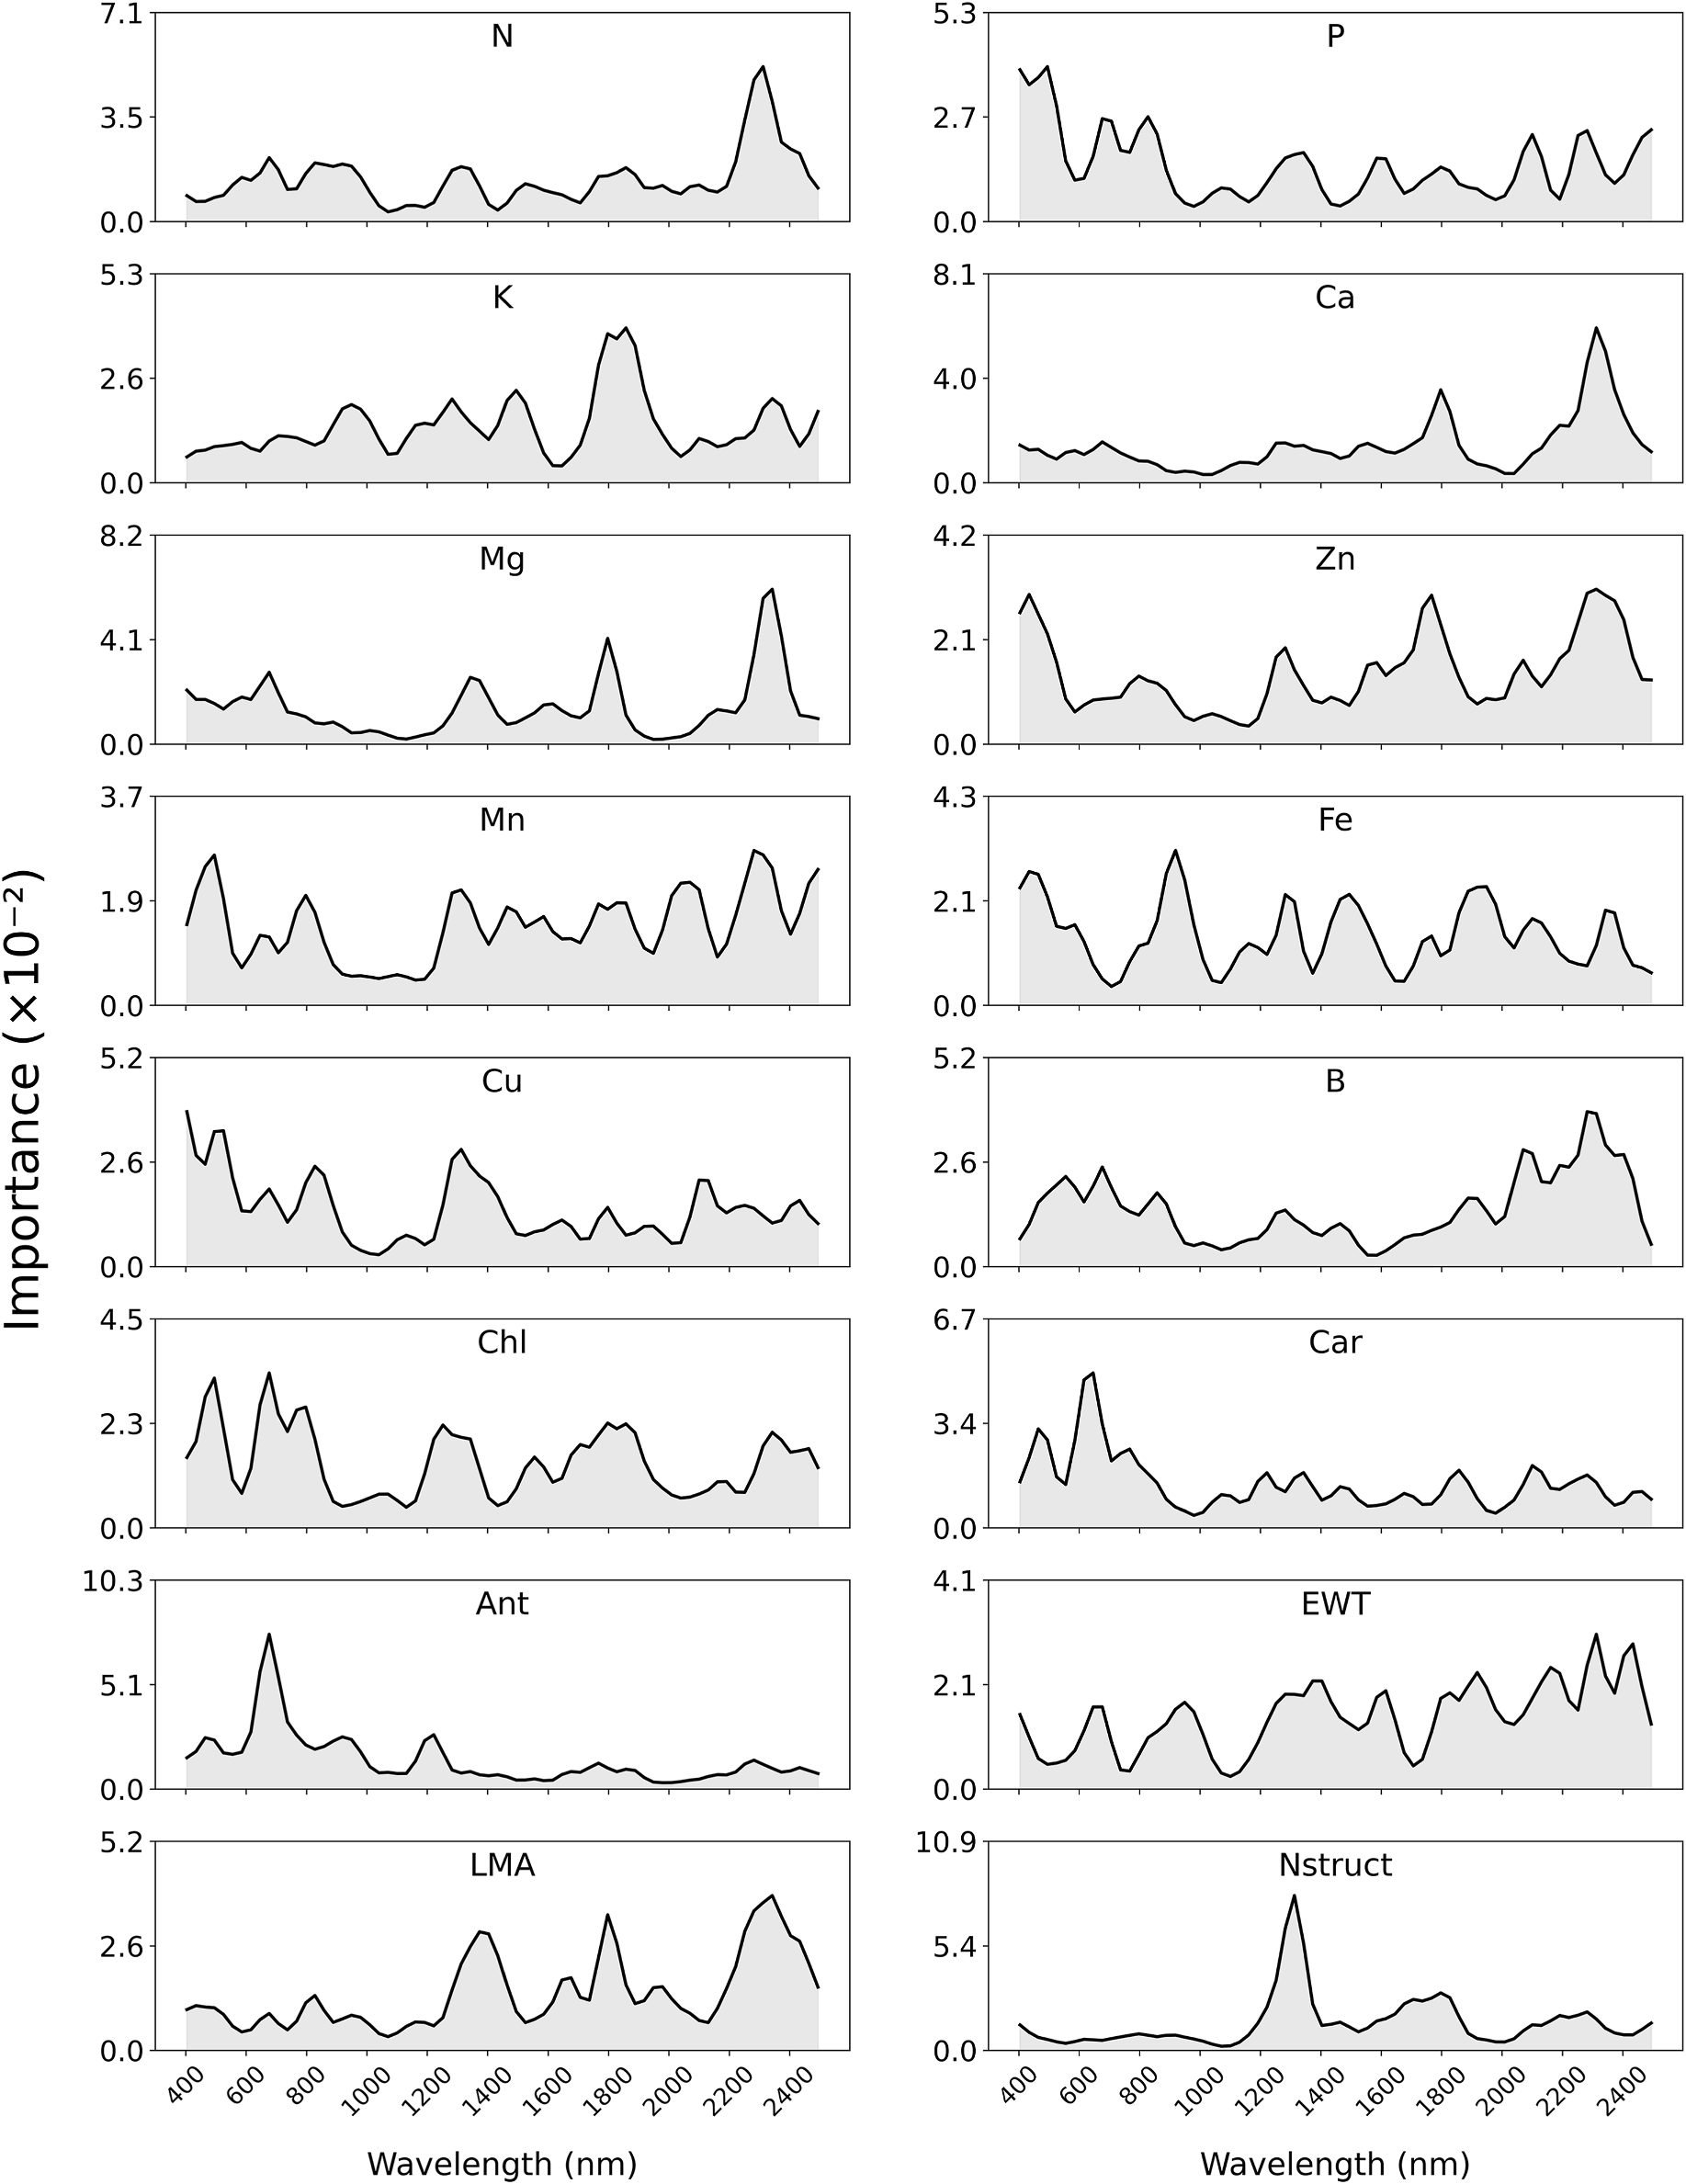
Mohammadreza Narimani spectral-band importance curves for 16 grapevine leaf traits from 400 to 2500 nm
Figure 3. Importance of spectral bands in predicting each grapevine leaf trait.
Mohammadreza Narimani pairwise trait correlations and overlapping spectral-band importance among 16 grapevine leaf nutrients and pigments
Figure 4. Pairwise correlations (lower left) and shared important spectral bands (upper right) for each trait pair.
Mohammadreza Narimani PCA of grapevine leaf spectra with 95 percent ellipses by variety, phenology, and year
Figure 5. PCA of spectral data across all datasets with 95% confidence ellipses.
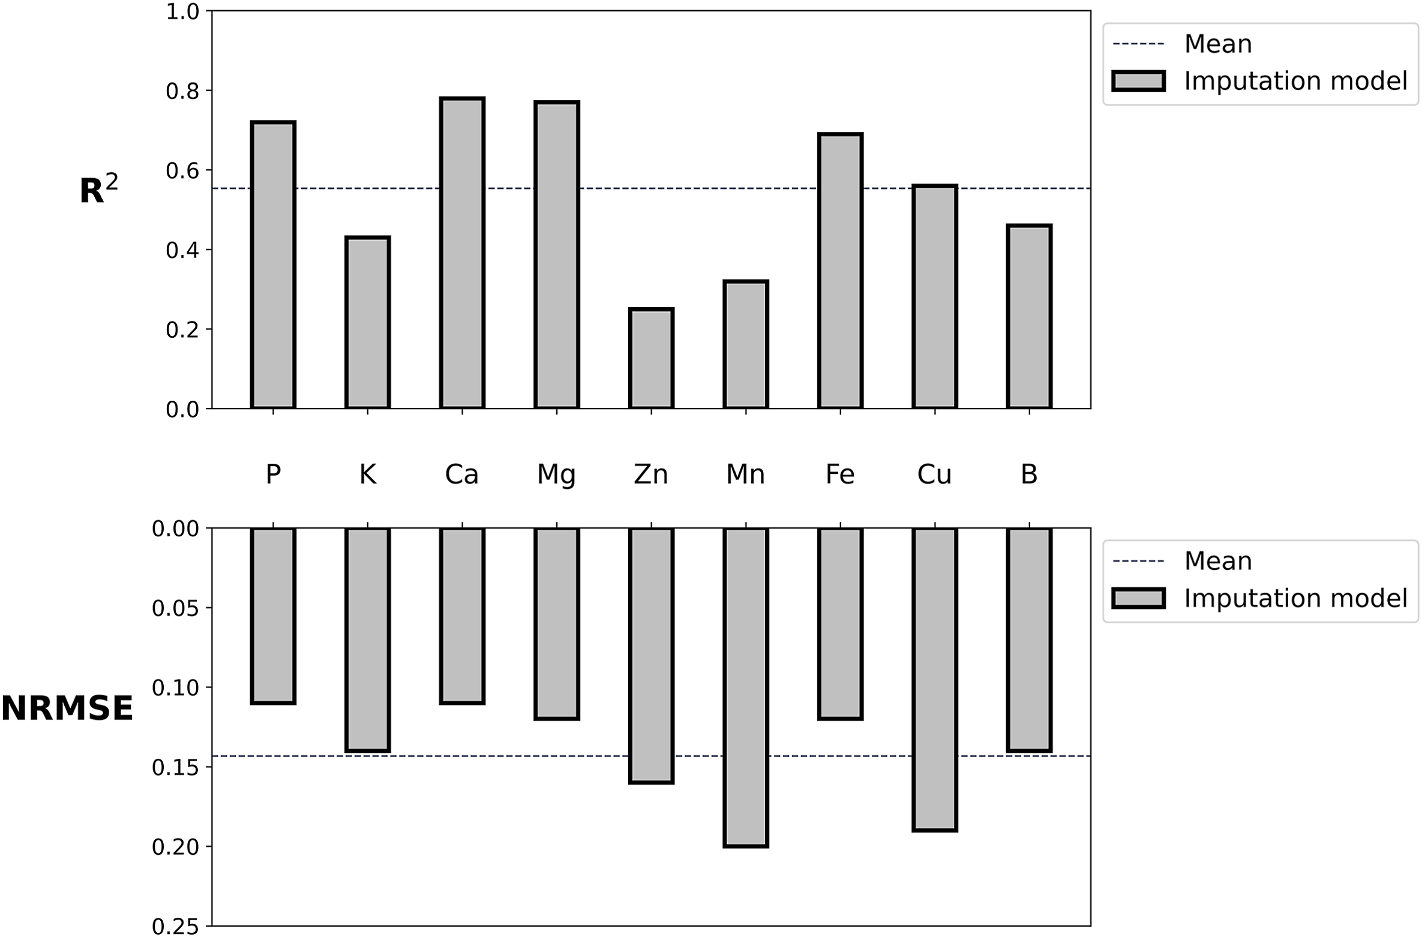
Mohammadreza Narimani imputation-model R-squared and NRMSE for grapevine leaf nutrients phosphorus potassium calcium magnesium zinc manganese iron copper and boron
Figure 6. Imputation-model performance for mineral nutrients used to complete missing labels.

The multi-trait CNN–LSTM outperformed separately trained single-trait networks on most nutrients and pigments. Headline lifts versus single-trait models include nitrogen R² 0.42 vs 0.26, phosphorus 0.81 vs 0.64, Nstruct 0.90 vs 0.25, and manganese 0.62 vs 0.30, with lower NRMSE and higher RPD.
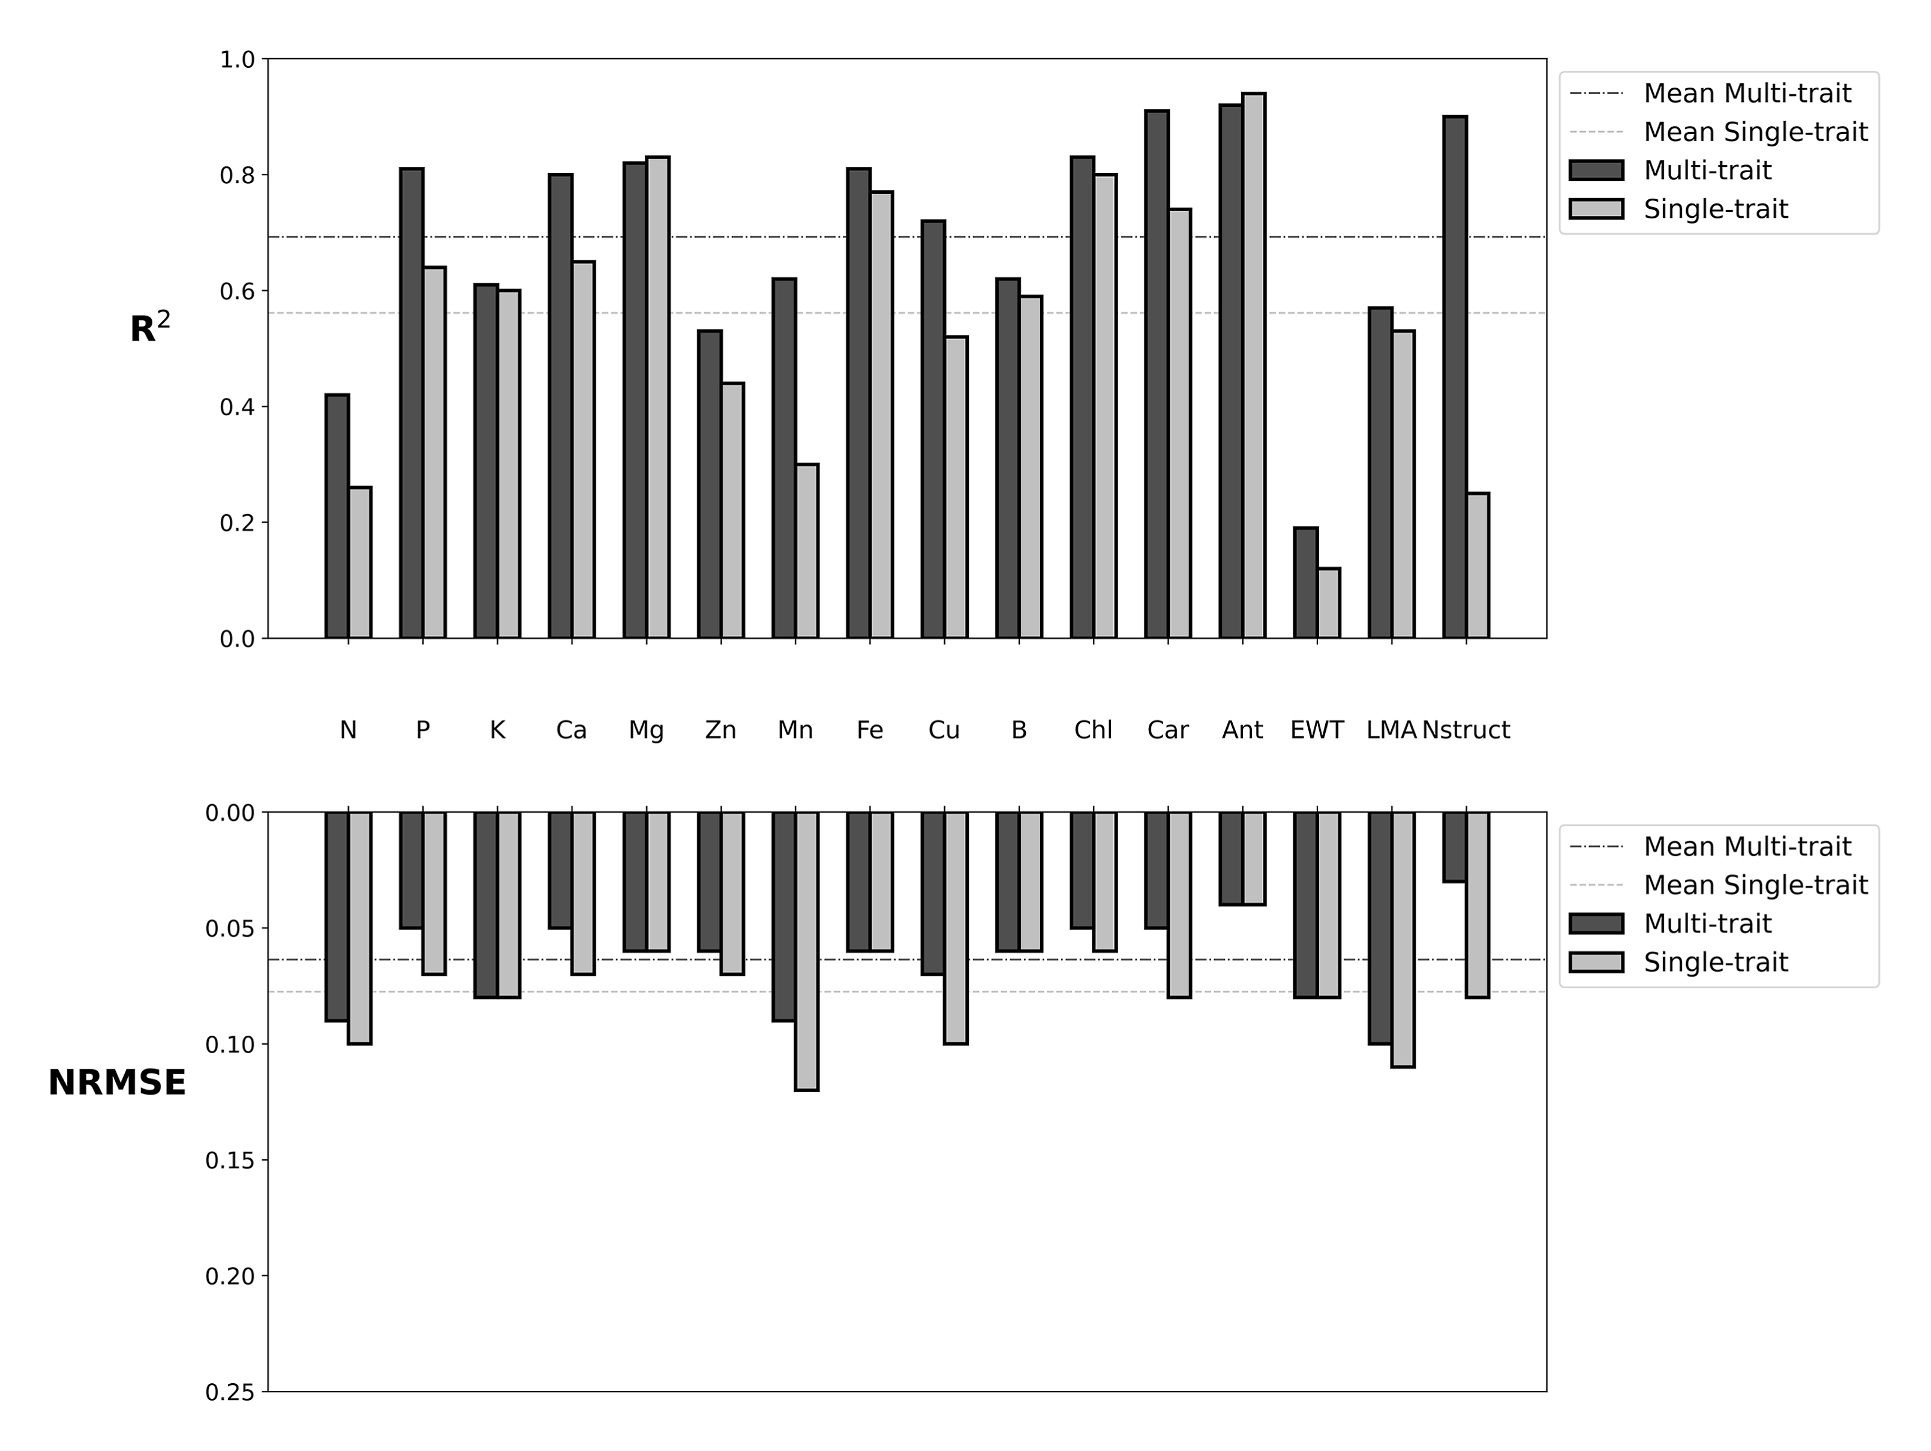
Mohammadreza Narimani bar charts of R-squared and NRMSE for 16 grapevine leaf traits comparing multi-trait and single-trait CNN-LSTM spectral models
Figure 7. Multi-trait versus single-trait performance (R² and NRMSE) across 16 grapevine leaf traits.
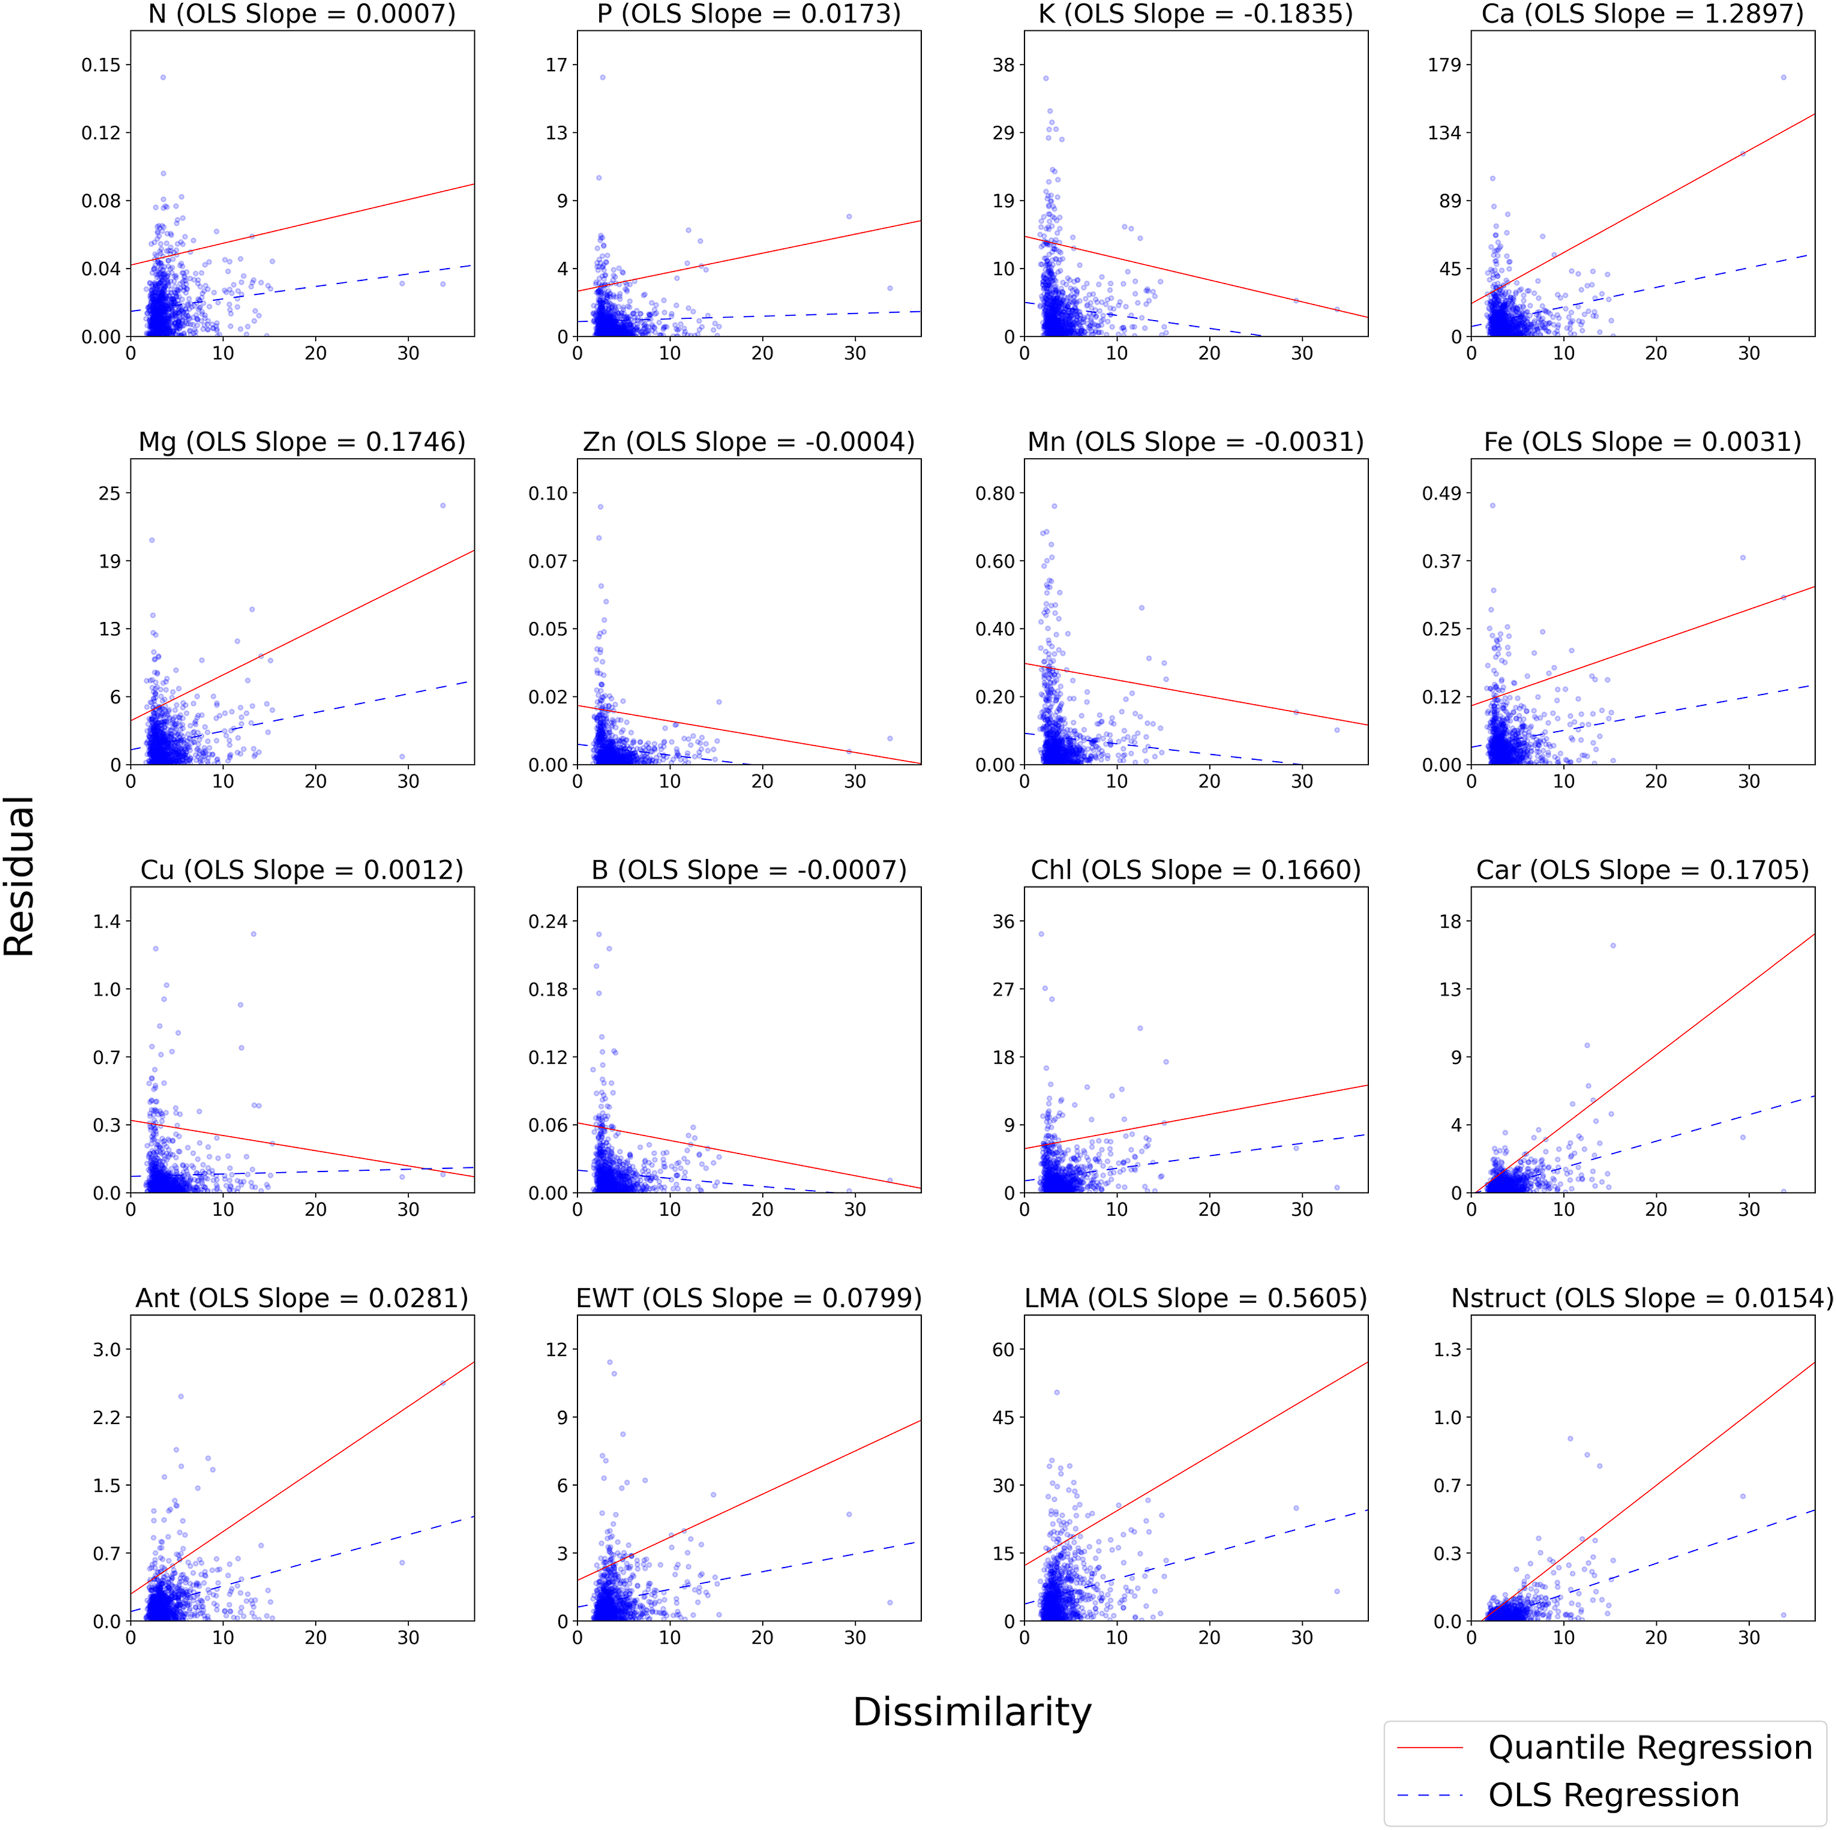
Mohammadreza Narimani residual versus spectral dissimilarity plots for multi-trait versus single-trait grapevine leaf models
Appendix C-1. Spectral dissimilarity versus prediction residual in the multi-trait and single-trait models.
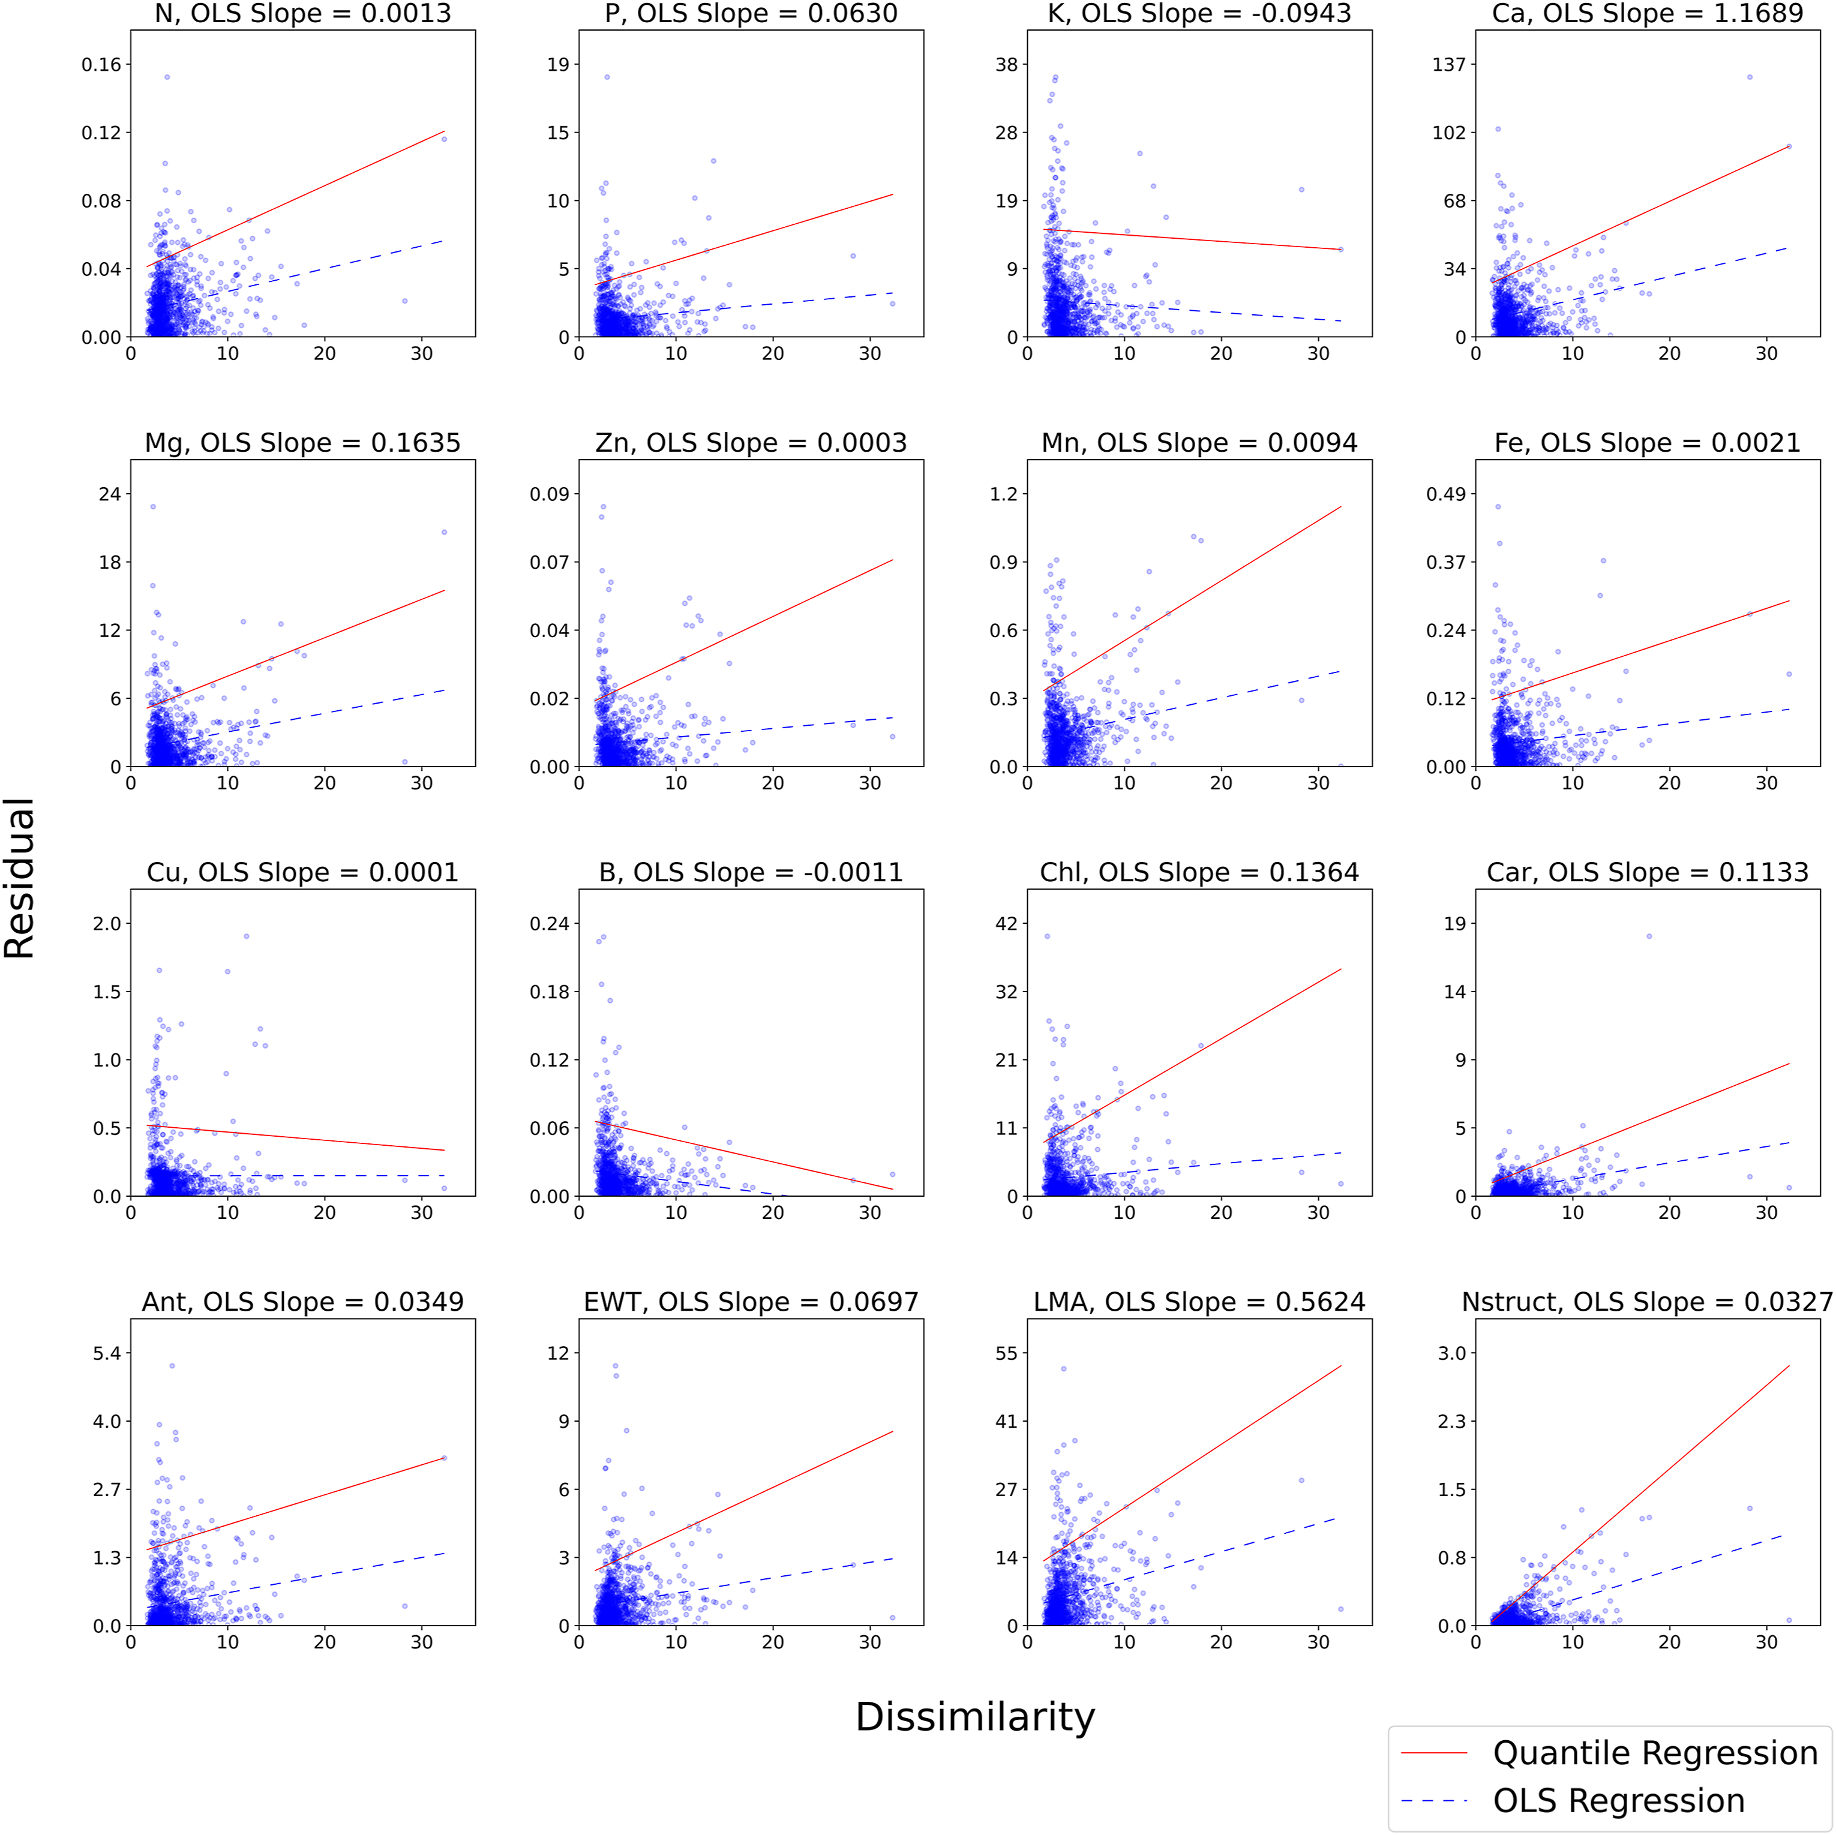
Mohammadreza Narimani residual versus spectral dissimilarity plots for the multi-trait grapevine leaf CNN-LSTM
Appendix C-2. Spectral dissimilarity versus prediction residual in the multi-trait model.
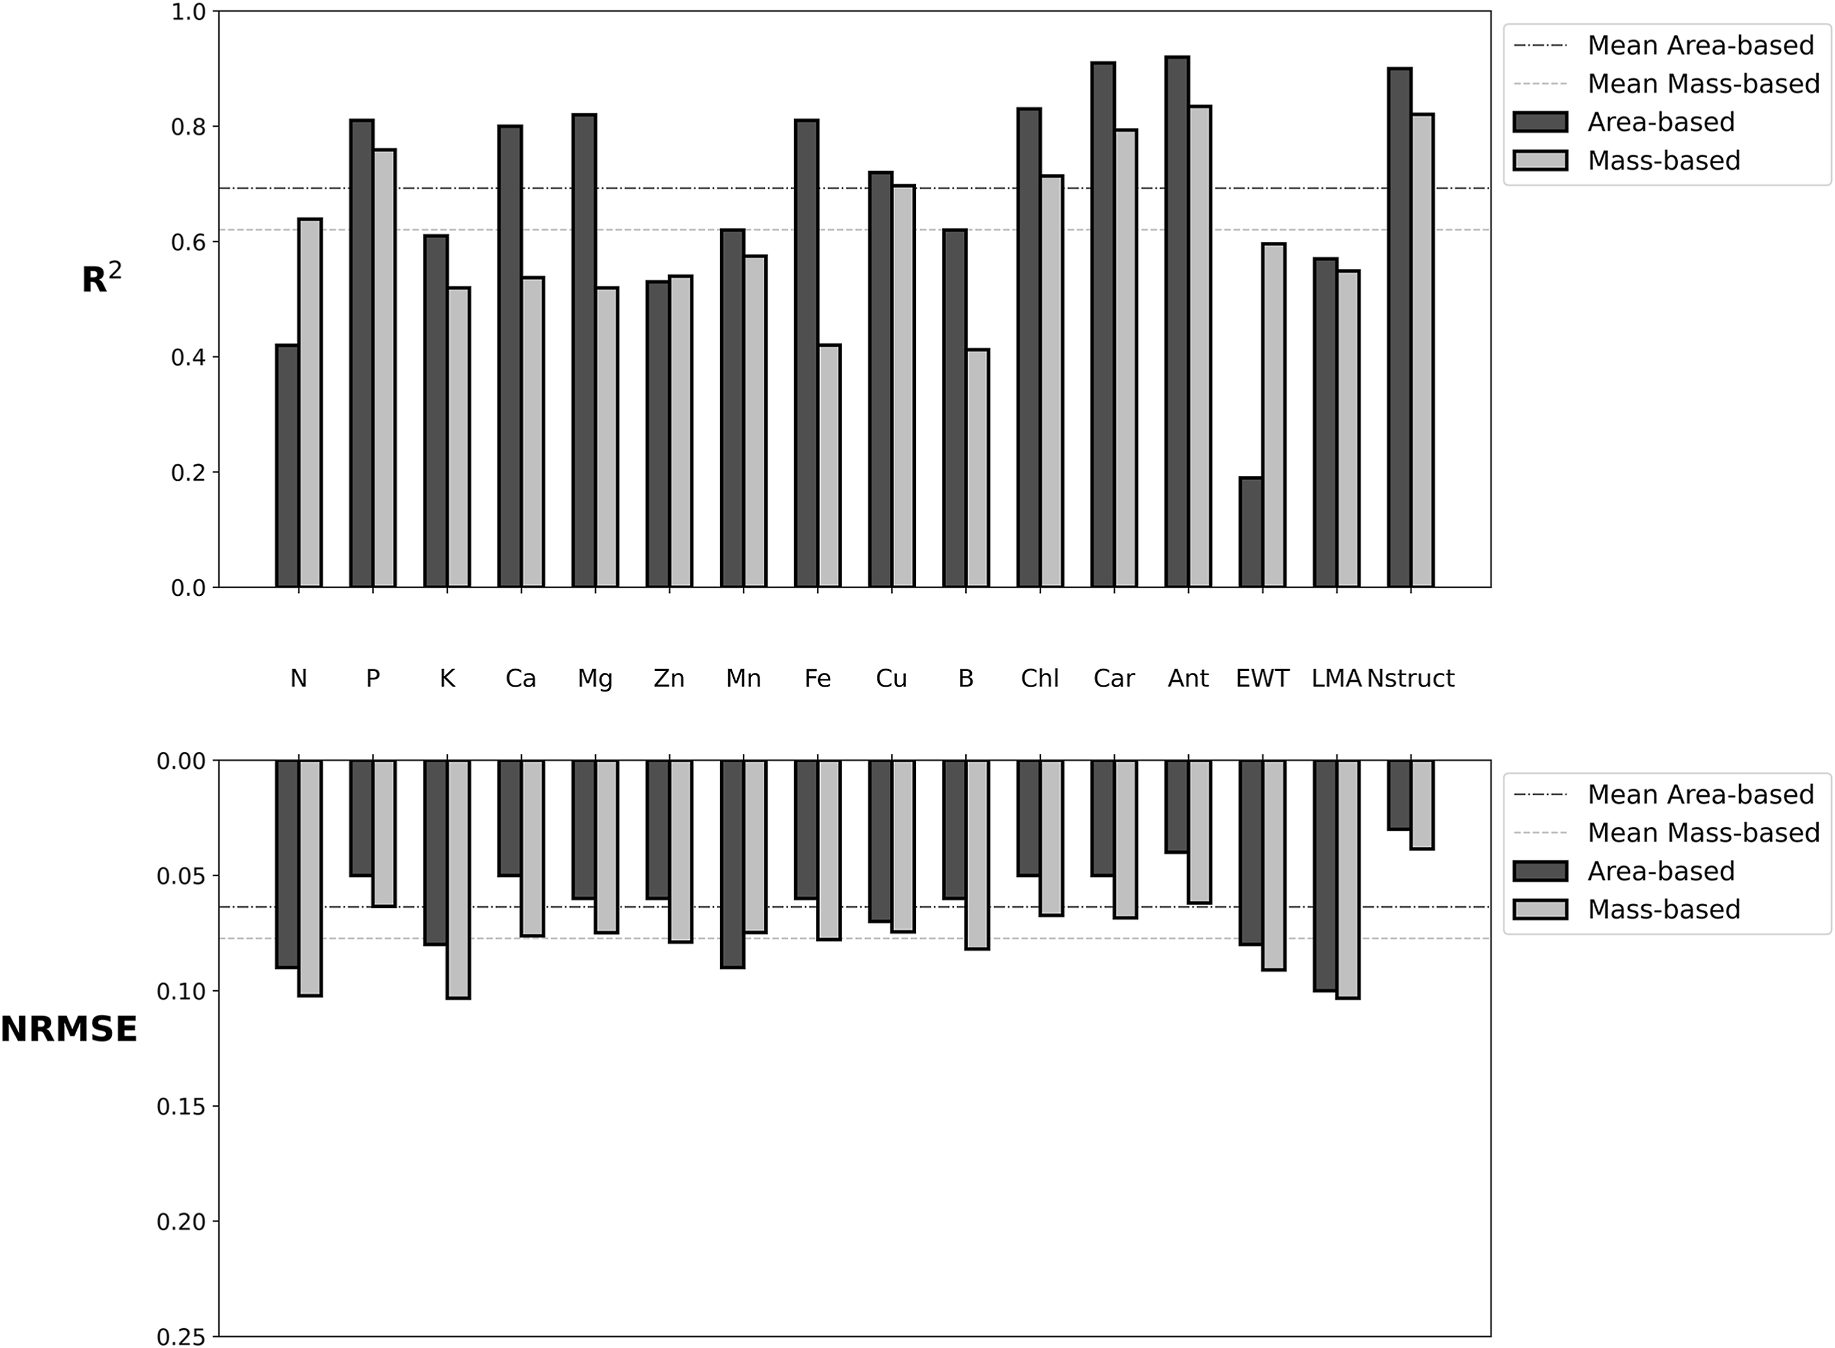
Mohammadreza Narimani R-squared and NRMSE for grapevine leaf traits comparing area-based and mass-based units
Appendix D. Area-based versus mass-based multi-trait performance (R² and NRMSE).
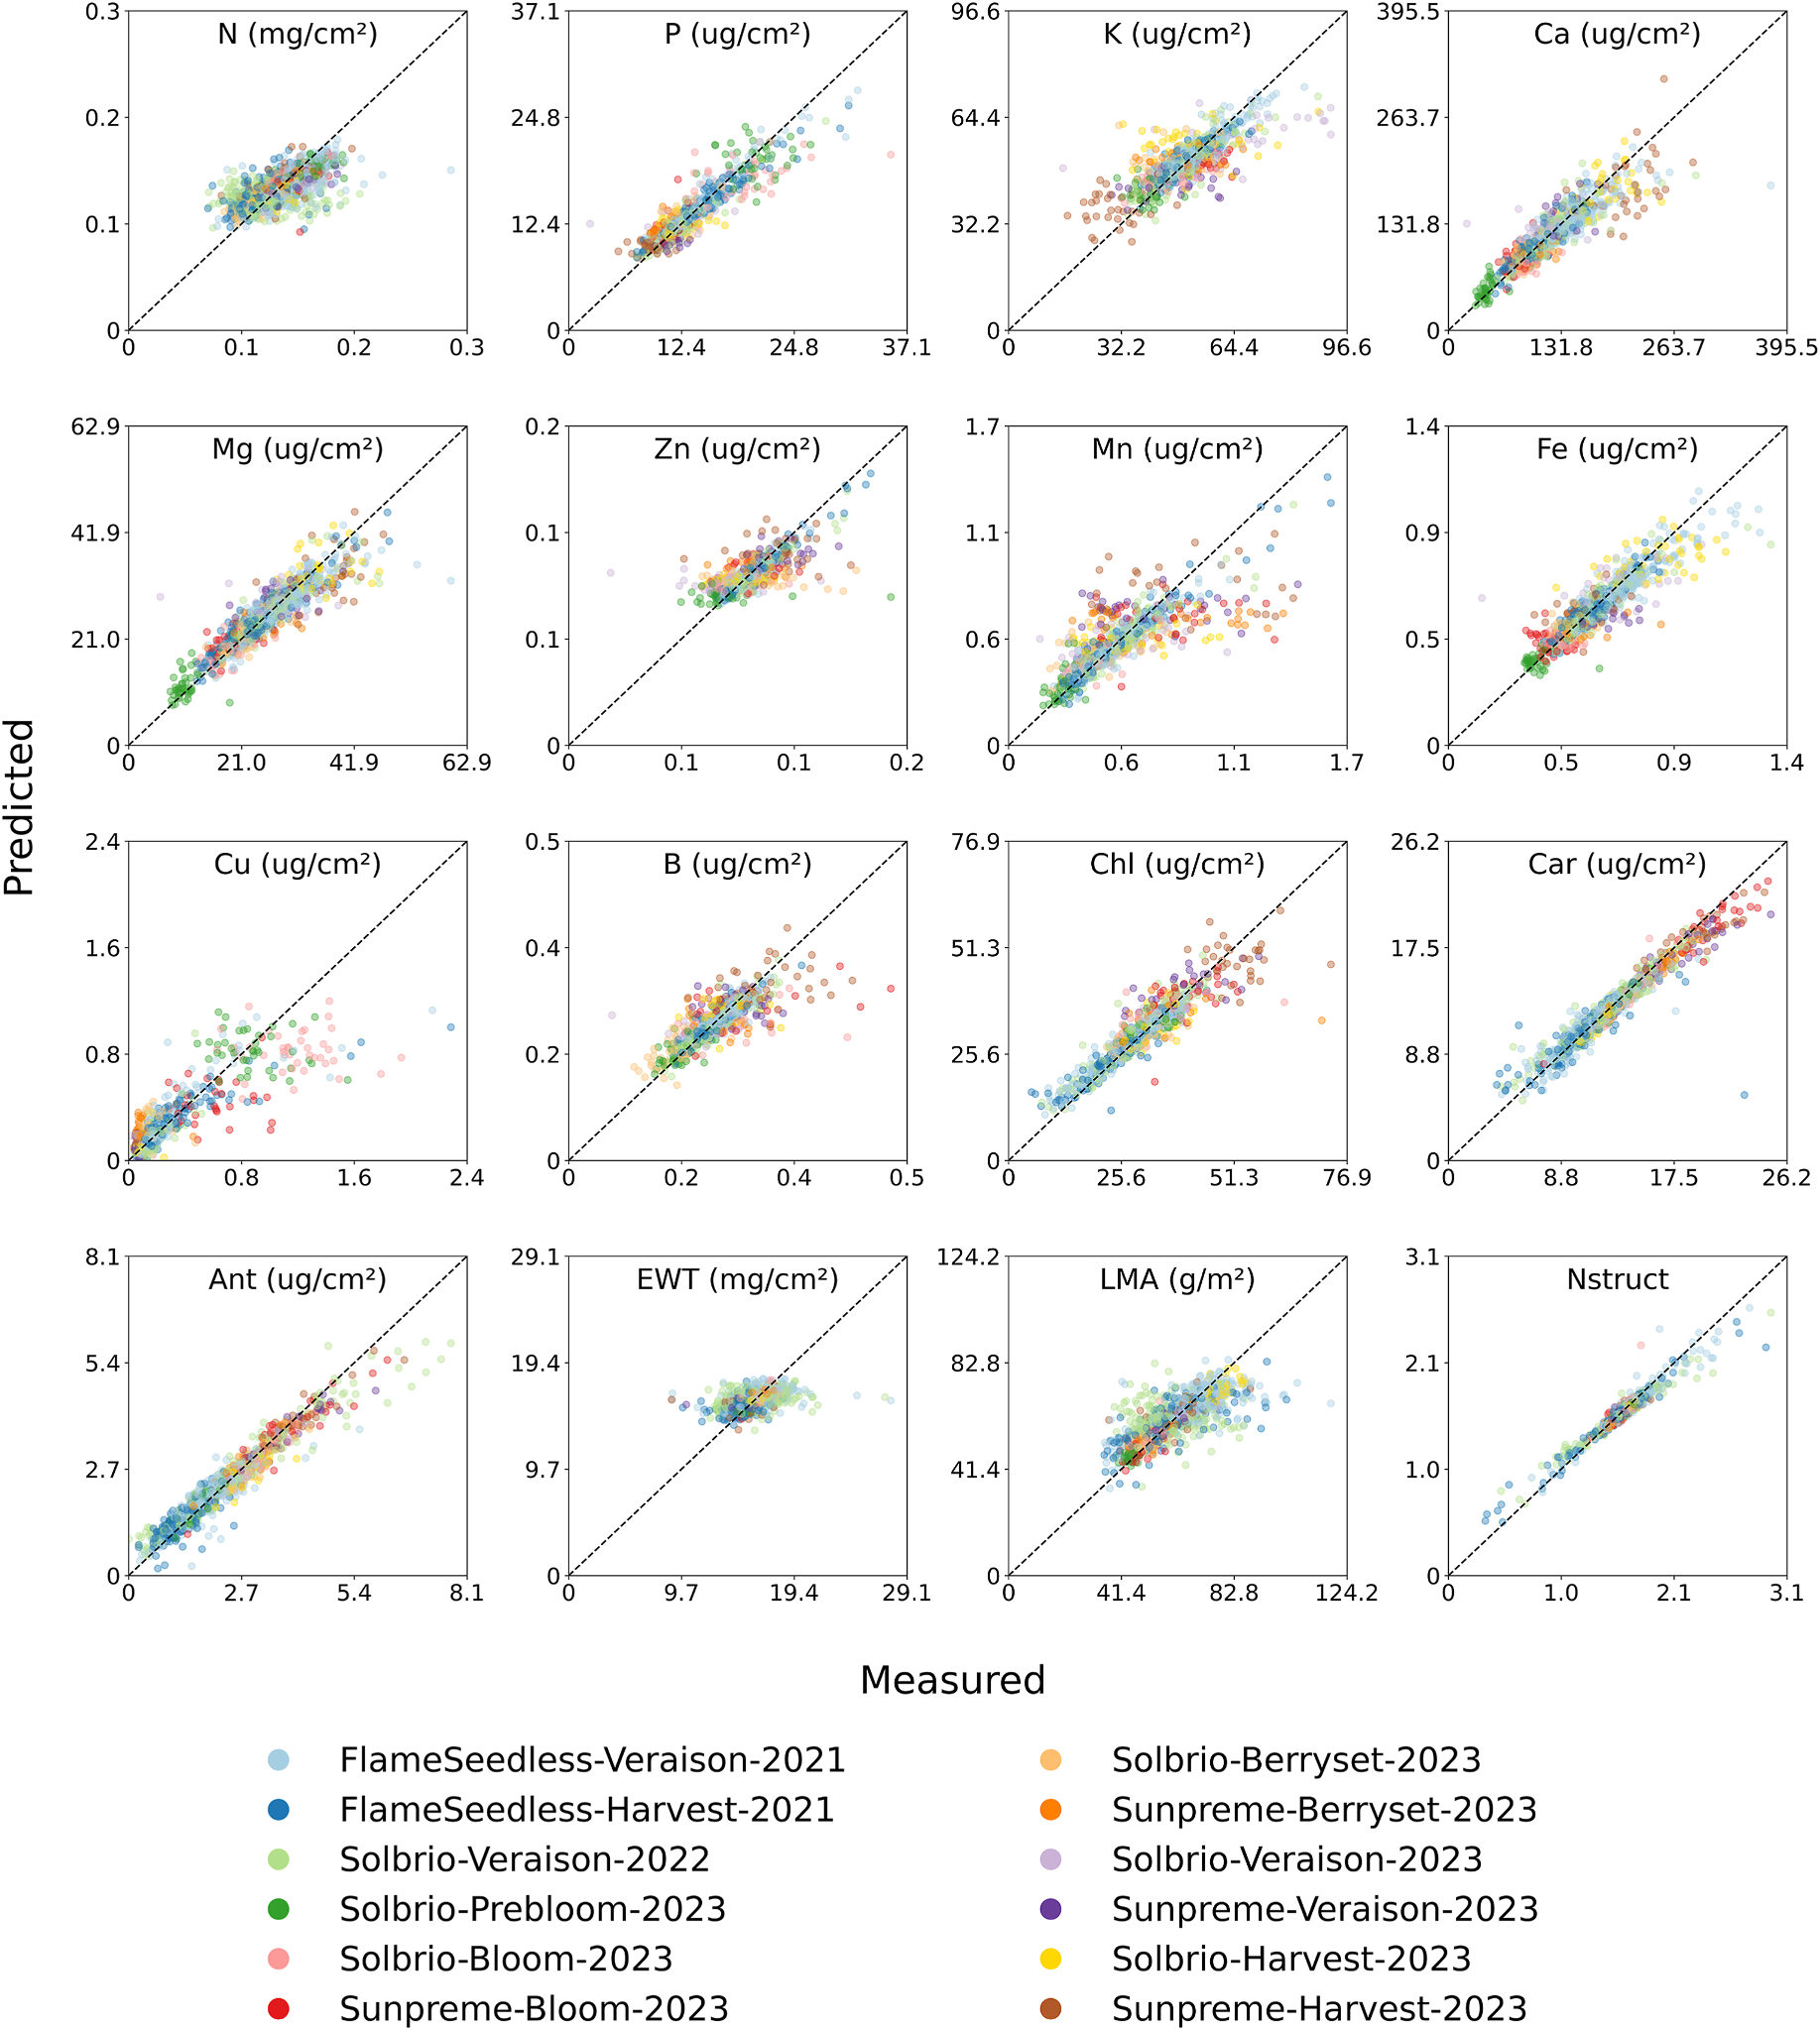
Mohammadreza Narimani predicted versus measured grapevine leaf traits colored by variety and phenology
Predicted versus measured grapevine leaf traits (area basis) across variety and phenology.

Shared spectra

One backbone sees every band group, so pigments, water, and nutrients regularize each other.

Imputation weights

Fully measured leaves count more than PROSPECT-filled labels during training.

Viticulture use

A practical route from handheld or lab spectra toward multi-nutrient vineyard diagnostics.

Paper and Citation

Farajpoor, P., Pourreza, A., Narimani, M., El-Kereamy, A., & Fidelibus, M. W. (2025). Multi-trait spectral modeling for estimating grapevine leaf traits and nutrients. Plant Phenomics, 7, 100142.

DOI: 10.1016/j.plaphe.2025.100142 · Open access under CC BY 4.0

Please cite the publisher version when you use this work. The summary on this page is a research card, not a substitute for the article.

Contact

Mohammadreza Narimani
PhD Candidate, University of California, Davis

📧 mnarimani@ucdavis.edu  |  🎓 Google Scholar