🌎 Global Vegetation and Climate Insights Portal (GVCIP)
By Mohammadreza Narimani, PhD Candidate at UC Davis
Published: Summer 2024 | Digital Agriculture Laboratory
Introduction
Global climate variability, environmental change, and extreme weather events increasingly demand reliable, high-resolution environmental monitoring tools. As a PhD Candidate at UC Davis specializing in remote sensing, climate analytics, and AI for environmental applications, I mentored my undergraduate mentee, through an ambitious project: building an interactive, global-scale environmental monitoring portal powered by Google Earth Engine (GEE).
Together, we developed the Global Vegetation and Climate Insights Portal (GVCIP)—a web application that visualizes global vegetation health, land surface temperature, evapotranspiration, precipitation, and more. My mentee successfully presented this project at the UC Davis College of Engineering, where both of us received certificates for our contributions.
This blog post highlights the project goals, features, methodology, poster, and our presentation.
Project Overview
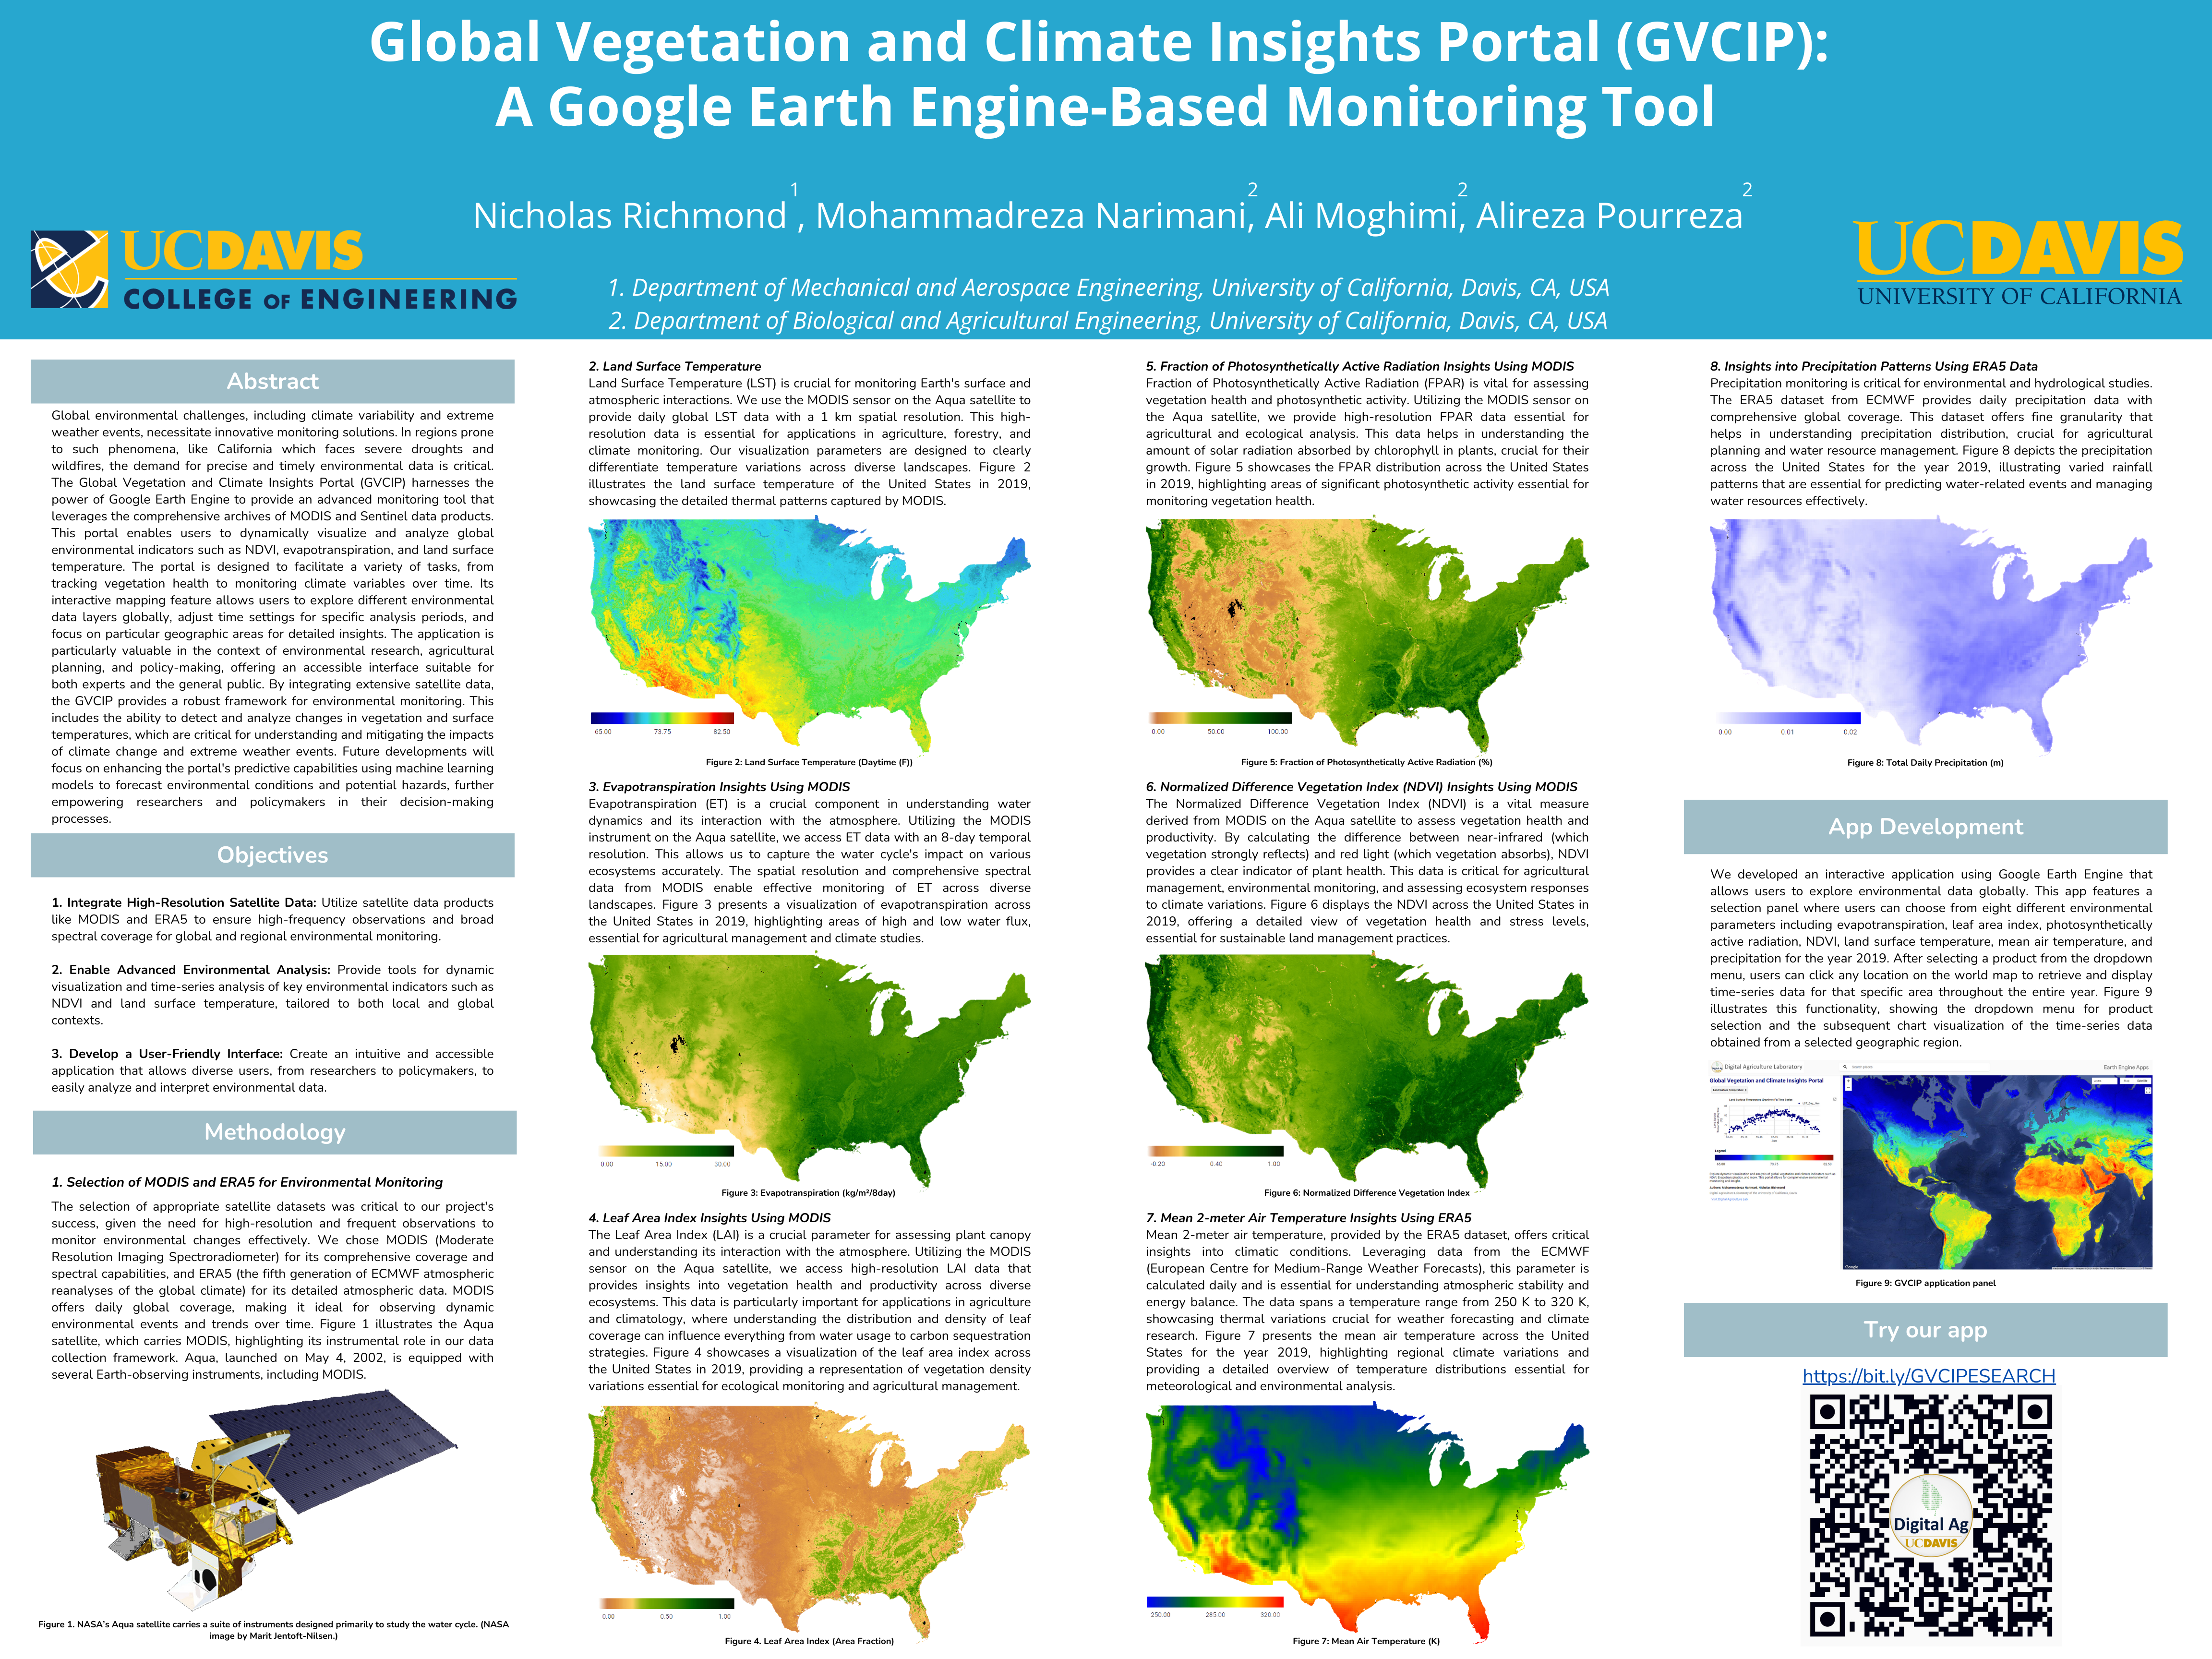
Project Title: Global Vegetation and Climate Insights Portal (GVCIP): A Google Earth Engine–Based Monitoring Tool
Authors: Nicholas Richmond, Mohammadreza Narimani, Ali Moghimi, Alireza Pourreza
Affiliation: Digital Agriculture Laboratory, UC Davis
The GVCIP portal uses MODIS, Sentinel, and ERA5 datasets within GEE to provide global, interactive maps of key environmental indicators, including:
- NDVI (Normalized Difference Vegetation Index)
- Evapotranspiration (ET)
- Land Surface Temperature (LST)
- Leaf Area Index (LAI)
- Fraction of Photosynthetically Active Radiation (FPAR)
- Mean 2-meter Air Temperature (ERA5)
- Total Daily Precipitation (ERA5)
Mentoring the Project
Mentoring my undergraduate student on this project involved guiding them through:
- Understanding remote sensing datasets (MODIS, ERA5, Sentinel)
- Learning Earth Engine JavaScript programming
- Designing interactive UI elements (dropdown menus, map layers, charts)
- Implementing time-series extraction
- Creating data legends and visualization styles
- Developing and deploying the web app
- Writing the full research poster
- Presenting at the UC Davis ESEARCH and COE events
My mentee showed exceptional dedication and creativity, and I am proud to highlight their work here.

Key Features of the Portal
1️⃣ Interactive Global Environmental Mapping
Users can explore global datasets with smooth map visualization, zooming, and clicking to retrieve time-series data.
2️⃣ Dynamic Data Layer Selection
Switch between NDVI, LST, ET, precipitation, vegetation indexes, and more.
3️⃣ Time-Series Chart Extraction
Click any location on the map to visualize the full year's data trend.
4️⃣ Automated Scaling & Color Legend
The legend updates based on the dataset selected, providing accurate interpretation.
5️⃣ Region-Specific Environmental Analysis
Analyze climate and vegetation conditions for any country, region, or pixel.
Methodology Overview
According to the project poster:
1. Dataset Selection
- MODIS for NDVI, LAI, FPAR, ET, and LST
- ERA5 for temperature and precipitation
These datasets provide high spatial and temporal resolution, essential for environmental monitoring.
2. Visualization & Mapping
Each environmental indicator is mapped using custom visualization parameters for clarity and consistency.
3. Time-Series Analysis
The app fetches year-long data for any clicked pixel, generating a plot for insights into seasonal changes.
4. User-Friendly Interface
A clean GEE-based UI ensures ease of use for both technical and non-technical audiences.
Explore the App & Code
Achievements
At the UC Davis College of Engineering Poster Presentation, my mentee and I were recognized with certificates for our contribution to environmental monitoring and remote sensing research.
This mentorship experience further reinforced my passion for guiding students in advanced remote sensing, climate analytics, and Google Earth Engine workflows.
About the Author
Mohammadreza Narimani
PhD Candidate, University of California, Davis
Remote Sensing • Digital Agriculture • Earth Observation • AI for Climate Analytics
I specialize in developing satellite-based environmental monitoring systems and mentoring students in remote sensing, Python, GEE, and applied AI.
📧 mnarimani@ucdavis.edu
🎓 Google Scholar Profile
Conclusion
The Global Vegetation and Climate Insights Portal represents an important step toward building accessible, interactive environmental intelligence tools. Through this project, my mentee gained hands-on experience in satellite analytics, Earth Engine development, scientific communication, and research presentation.
As climate challenges continue to grow, tools like GVCIP will play a vital role in supporting environmental research, sustainable agriculture, and data-driven policy.