🍅 California Tomato Landcover Viewer
Digital Agriculture Laboratory | University of California, Davis
Interactive Tomato Crop Mapping
This Google Earth Engine application allows users to explore tomato crop distribution across California from 2015–2023. Using USDA Cropland Data Layer (CDL) data, the app highlights tomato fields in bright red, making it easy for growers, researchers, and policymakers to understand statewide tomato production patterns.
Developed at the Digital Agriculture Laboratory, UC Davis, this tool supports agricultural planning, policy development, and research in California's vital tomato industry.
How to Use the App
1️⃣ Select Year
Choose any year from 2015 to 2023 to view tomato crop distribution for that specific growing season.
2️⃣ Explore California
Navigate across California to see tomato production areas highlighted in bright red on the interactive map.
3️⃣ Compare Years
Switch between different years to analyze changes in tomato cultivation patterns over time.
4️⃣ Analyze Patterns
Identify major tomato growing regions and understand spatial distribution across California's agricultural landscape.
Visual Examples
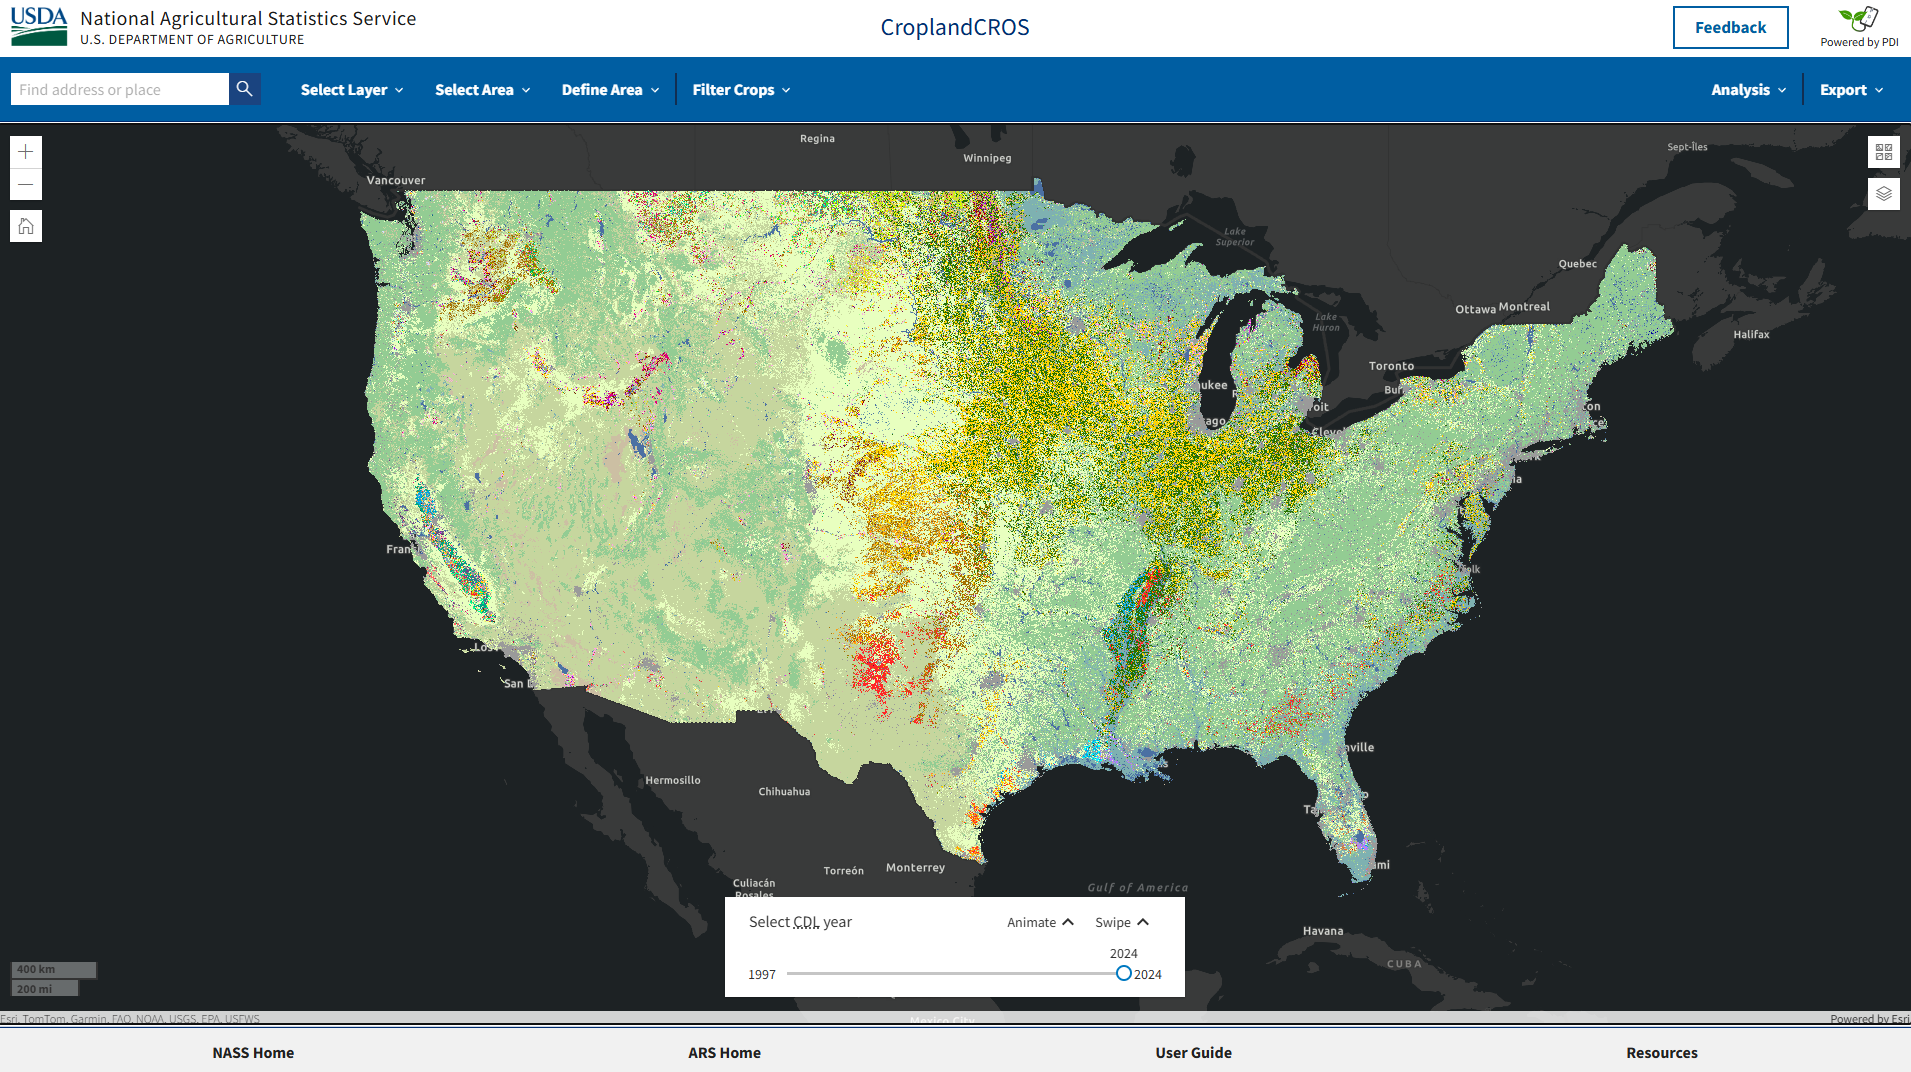
USDA Cropland Data Layer (All Crops, 2024)
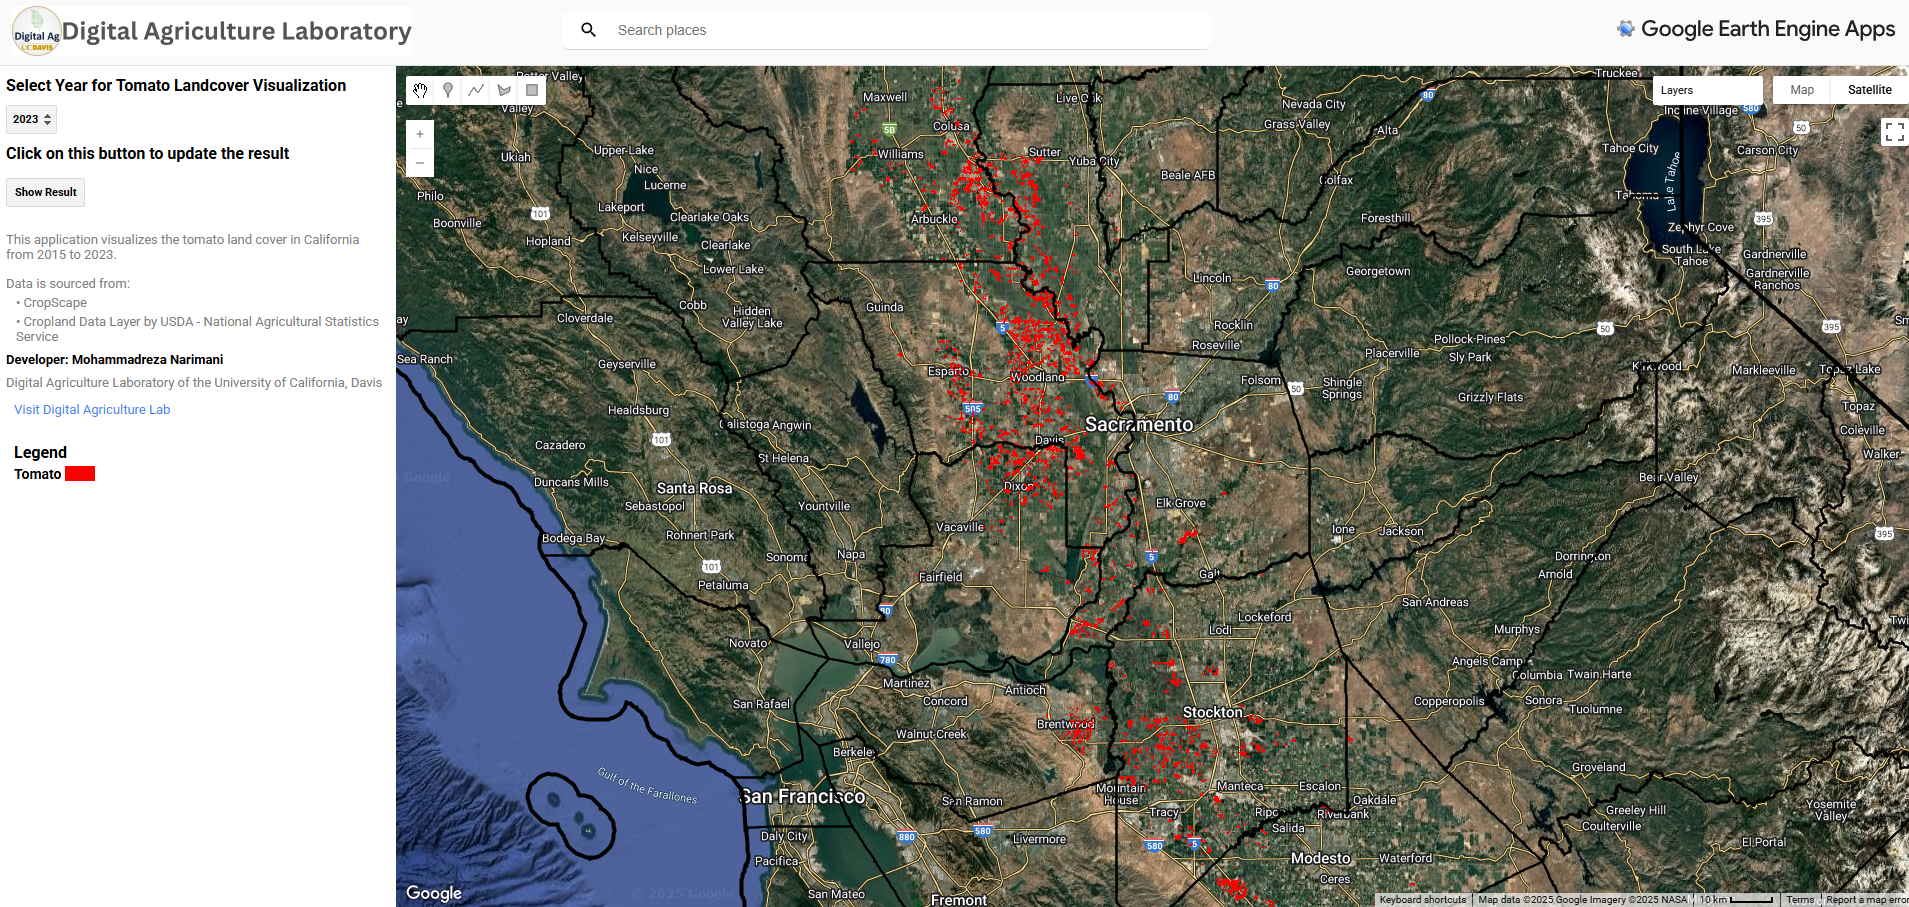
Tomato Landcover (California, 2023 – From Our App)
Try the Interactive App
Select a year (2015–2023) and instantly visualize tomato acres across California
Technical Information
Data Source
- USDA Cropland Data Layer (CDL) from NASS
- 30-meter resolution annual crop maps
- Covers 2015-2023 growing seasons
- Google Earth Engine cloud computing platform
Source: USDA NASS Cropland Data Layer
Application Features
- Interactive year selection (2015-2023)
- Tomato fields highlighted in bright red
- Statewide California coverage
- High-resolution crop mapping
- Time-series analysis capability
Resources & Links
About the Developer
Mohammadreza Narimani
PhD Candidate, University of California, Davis
Remote Sensing • Digital Agriculture • Google Earth Engine • Agricultural Mapping
Developing satellite-based tools for crop monitoring and agricultural analysis at the Digital Agriculture Laboratory at UC Davis.
📧 mnarimani@ucdavis.edu
🎓 Google Scholar Profile